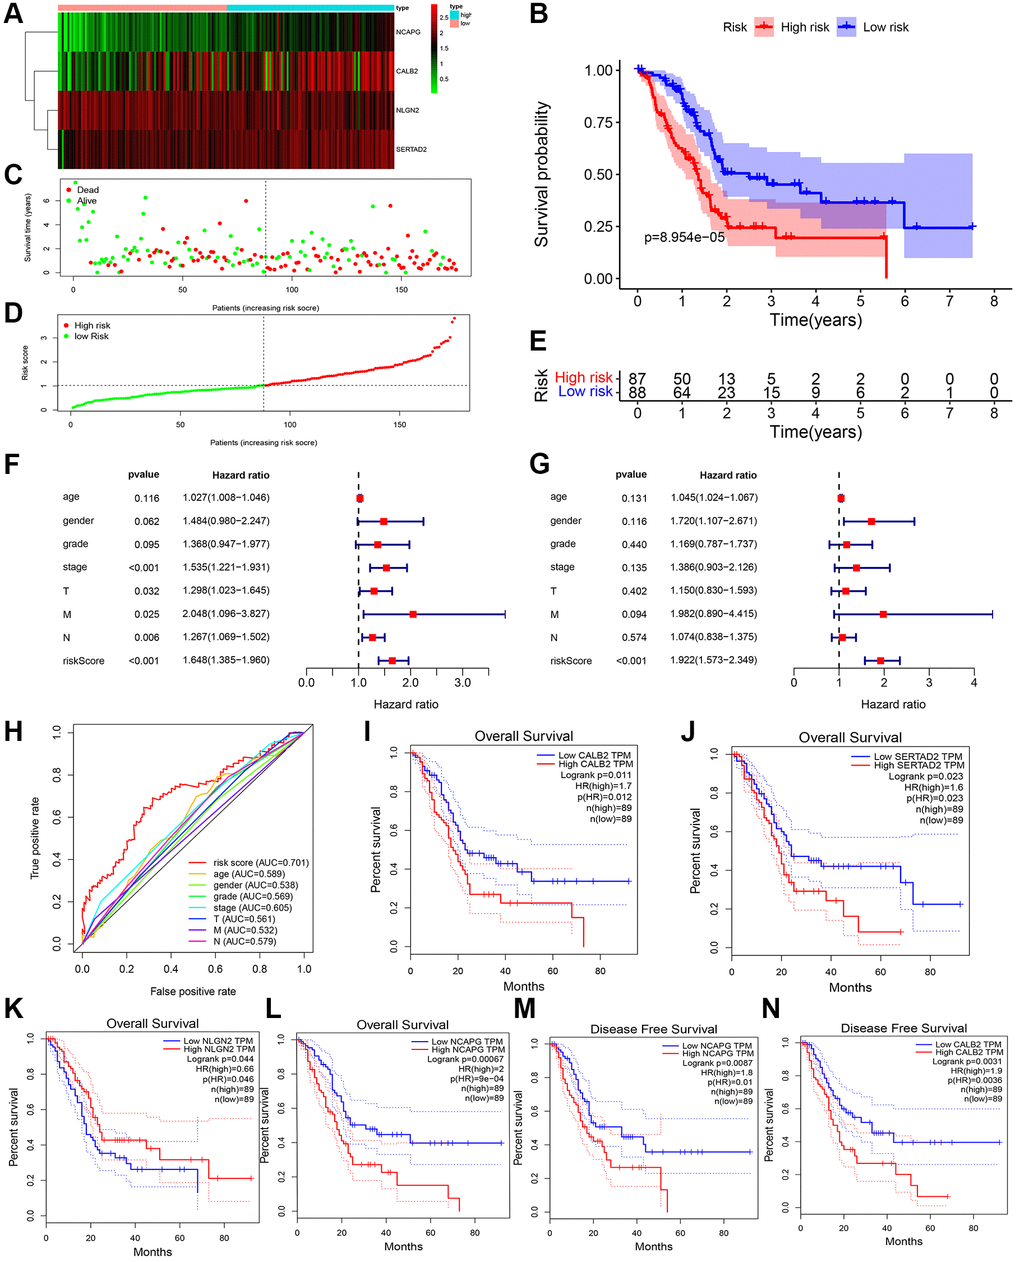
Figure 5.ADCP-associated risk score of PDAC patients and validation in TCGA cohorts. (A) Heatmap of the 4 screened ARGs in TCGA-PAAD cohort. (B) Survival analysis of high-risk group and low-risk group. (C) Number of patients in low risk group and high risk group. (D and E) The distribution of patients by risk score in TCGA-PAAD. (F) Univariate cox regression of clinical feature and risk score in TCGA-PAAD. (G) Multivariate cox regression of clinical feature and risk score in TCGA-PAAD. (H) ROC of risk score in TCGA-PAAD (I–N) Overall survival analysis and disease free survival analysis of the 4 genes in risk formula in TCGA-PAAD.