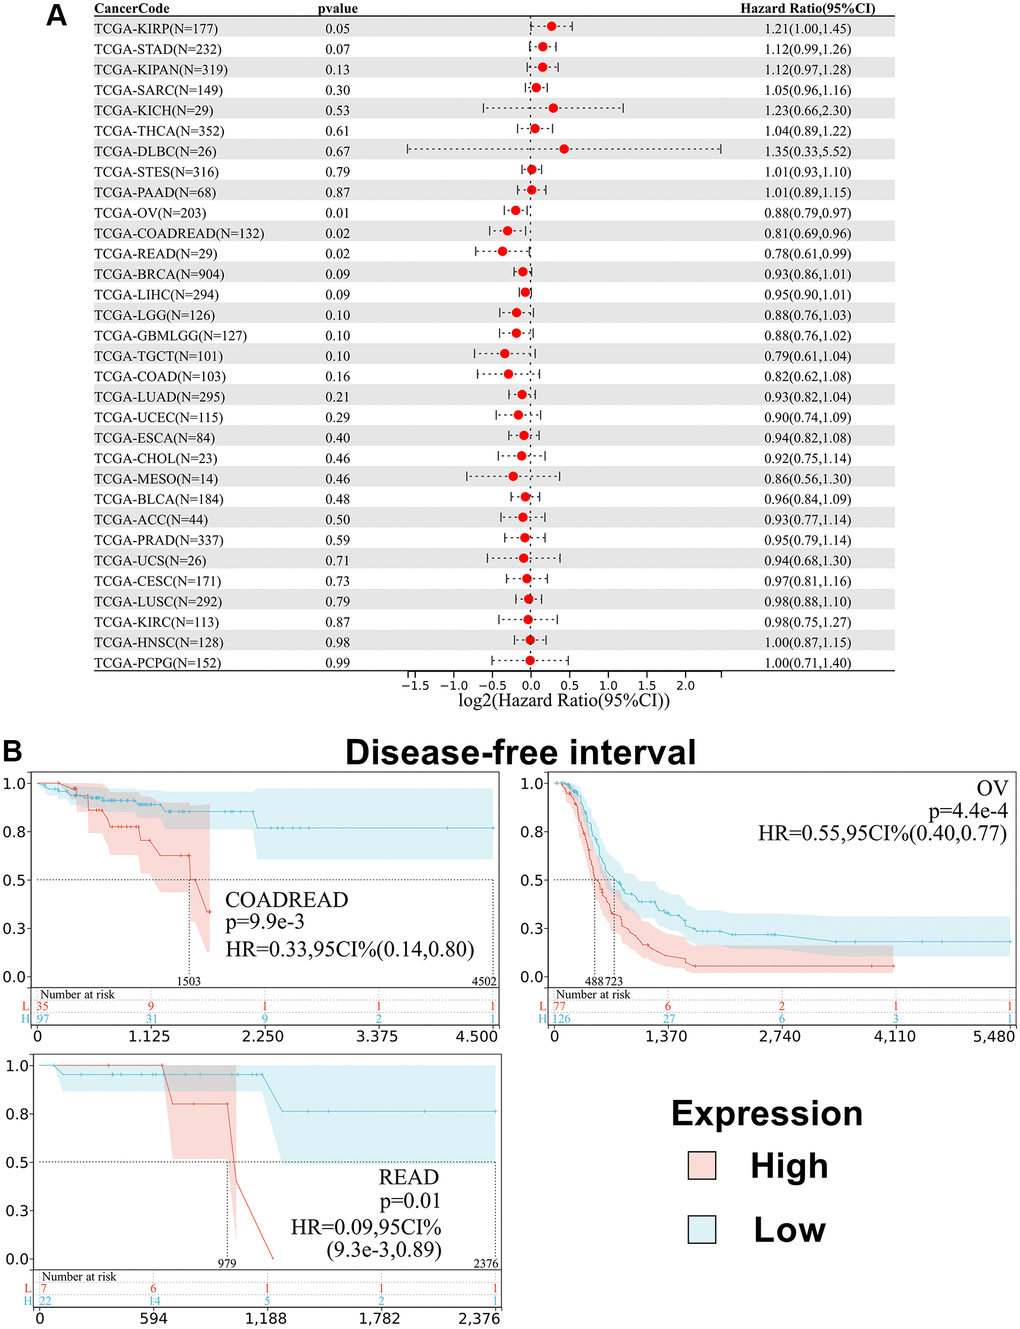
Figure 5.Relationship between SPIB expression and disease-free interval (DFI) in pan-cancer. (A) Cox regression analysis of SPIB in 44 tumors. (B) Kaplan-Meier OS curves of SPIB expression in patients with COADREAD, OV, and READ. The vertical coordinate is the survival probability, and the horizontal coordinate is the survival time (days).