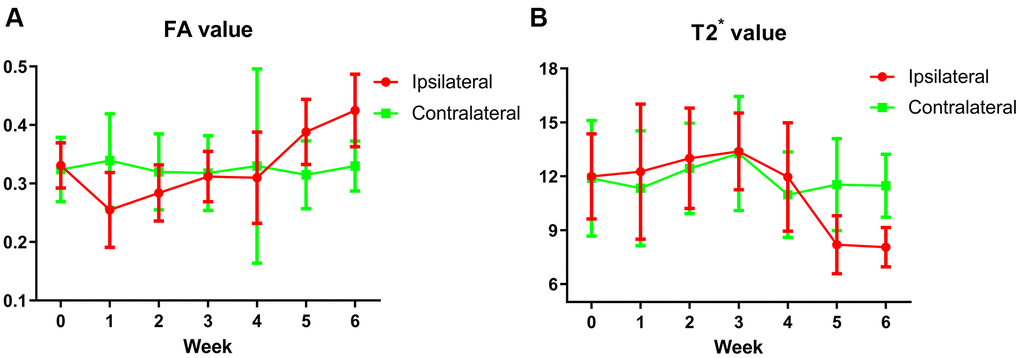
Figure 1.(A) The trend of FA values in the bilateral SNpc. The red broken line represents the change trend of FA values in SNpc on the lesion side before and after surgery every week, which decreased significantly in the 1st week, then gradually increased, and reached the peak in the 6th week. The green broken line represents the change trend of FA values of contralateral SNpc, which is basically flat before and every week after surgery. (B) The trend of T2* values in the bilateral SNpc. The red broken line represents the change trend of T2* values in SNpc on the lesion side before and after surgery every week, the T2* values began to decrease significantly at the 5th week, and decreased to the lowest at the 6th week. The green broken line represents the change trend of T2* values of contralateral SNpc, which is basically flat before and every week after surgery.