





Introduction
Parkinson’s disease (PD) is a common neurodegenerative disease in middle-aged and older individuals [1, 2]. The death of dopaminergic (DA) neurons in the substantia nigra pars compacta (SNpc) is the characteristic pathological change in PD [3]. Because it is difficult to obtain pathological brain specimens from PD patients [4], the diagnosis is mainly based on the typical clinical manifestations of PD, such as motor retardation, static tremor, muscle rigidity, and other motor symptoms [5]. The Hoehn–Yahr scale and Unified Parkinson’s Disease Rating Scale scores are used for evaluation [6], but their classification accuracy rate is not high [7]. A previous study found that at least 30% of DA neurons in the SNpc had died by the time that the above symptoms manifest [8]. In order to detect pathological changes of PD more accurately, a PD rat model is often used to simulate the pathogenesis and disease progression seen in PD patients [9]. The rodent model in which unilateral destruction of the SNpc is achieved by injection of 6-OHDA is one of the most widely used animal models of PD at present [10]. The pathological and biochemical manifestations in this rat model are similar to that in humans with PD [11], and include death and deletion of DA neurons in the SNpc, proliferation of glial cells [12], decrease of tyrosine hydroxylase (TH) activity and content in the SNpc and striatum [13].
If PD can be diagnosed and treated early, the prognosis of PD may be relatively good [14]. However, the current examination methods typically do not detect the disease in time [4]. Although the sensitivity and specificity of single-photon-emission computed tomography [15] and positron-emission tomography [16] performs acceptably in the diagnosis of PD and can support the early diagnosis of the disease, they are invasive and expensive [17]. Moreover, these approaches cannot be used for long-term follow-up monitoring of therapeutic efficacy in PD.
For nearly a decade, the continuous emergence of many new MRI technologies has provided a new perspective for clinicians for the early diagnosis of PD [18, 19]. Diffusion tensor imaging (DTI) is a relatively new brain functional imaging method. By studying the diffusion anisotropy of water molecules in relevant brain regions, the loss of DA neurons in the SNpc of PD patients can be found early [20]. In recent years, some animal experimental studies had shown that DA neurons undergo specific degeneration within the 1st to 3rd week after injection of 6-OHDA in rats [21]. Liu et al. studied a Sprague–Dawley (SD) rat model with 6-OHDA-induced damage. The fractional anisotropy (FA) value of the SN in the PD model group was significantly lower than that in the control group at the 1st week after modeling. Fang et al. obtained the same experimental results and considered that this finding was related to neuron loss [22, 23]. Abnormal FA values are found early after the occurrence of the disease. On the other hand, iron deposition in the brain of PD patients is a widely recognized phenomenon. As T2*-weighted imaging (T2*WI) is sensitive to iron, recent studies have used T2*WI to evaluate the lesion area in PD model rats systematically. The T2* value of the SN was found to be significantly reduced by as early as the 4th week after 6-OHDA injection into rat brain, as compared to the control group [24].
The above two imaging methods play a very important role in the early diagnosis of PD in model rats, and have been used in many studies [25, 26]. However, there have been no reports on the sensitivity and specificity of the above two methods for the early diagnosis of PD, and no study has reported which method was more effective in diagnosing PD in these model animals.
Thus, in this study, we compared the sensitivity and specificity of using FA and T2*WI for the early diagnosis of 6-OHDA-induced PD in rat models to provide more accurate and noninvasive early diagnosis methods for clinical use.
Results
Comparison of FA and T2* values between the bilateral SNpc
After modeling, a weekly apomorphine rotation test was performed on rats from the 1st to the 6th week. The model was considered to be successful if the data of the rotation experiment exceeded 7 times per min for at least one week See Supplementary Figure 1 for details. After verification, all 20 mouse models were successful. When we compared the FA value on the 6-OHDA-lesioned side with that on the contralateral SNpc, we found that the FA value in the damaged SNpc had decreased significantly in the 1st week after operation, after which it gradually increased and peaked in the 6th week (Figure 1A). FA values differed statistically significantly between the bilateral SNpc in the 1st, 2nd, 5th, 6th weeks See Table 1 for details.
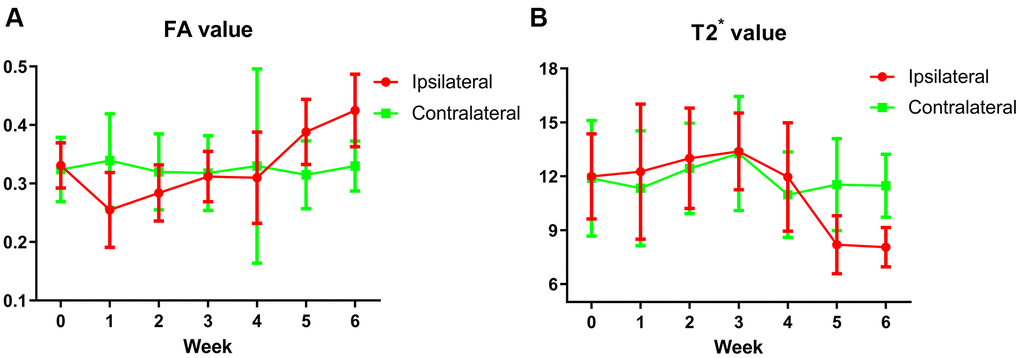
Figure 1. (A) The trend of FA values in the bilateral SNpc. The red broken line represents the change trend of FA values in SNpc on the lesion side before and after surgery every week, which decreased significantly in the 1st week, then gradually increased, and reached the peak in the 6th week. The green broken line represents the change trend of FA values of contralateral SNpc, which is basically flat before and every week after surgery. (B) The trend of T2* values in the bilateral SNpc. The red broken line represents the change trend of T2* values in SNpc on the lesion side before and after surgery every week, the T2* values began to decrease significantly at the 5th week, and decreased to the lowest at the 6th week. The green broken line represents the change trend of T2* values of contralateral SNpc, which is basically flat before and every week after surgery.
Table 1. Comparison of weekly FA and T2* values of bilateral SN.
| FA value | T2* value(ms) | ||||||||||||||||||||||||||||||||||||||||||||||||||||||||||||||||||||||||||||||||||||||||||||||||||
| Ipsilateral | Contralateral | t | p value | Ipsilateral | Contralateral | t | p value | ||||||||||||||||||||||||||||||||||||||||||||||||||||||||||||||||||||||||||||||||||||||||||||
| Pre-surgery | 0.331±0.039 | 0.324±0.055 | 0.506 | 0.618 | 11.994±2.372 | 11.889±3.215 | 0.105 | 0.917 | |||||||||||||||||||||||||||||||||||||||||||||||||||||||||||||||||||||||||||||||||||||||||||
| 1st week | 0.255±0.064 | 0.339±0.080 | 6.849 | <0.001* | 12.258±3.758 | 11.337±3.201 | 1.516 | 0.146 | |||||||||||||||||||||||||||||||||||||||||||||||||||||||||||||||||||||||||||||||||||||||||||
| 2nd week | 0.284±0.048 | 0.320±0.065 | 2.127 | 0.047* | 13.000±2.800 | 12.435±2.525 | 1.075 | 0.296 | |||||||||||||||||||||||||||||||||||||||||||||||||||||||||||||||||||||||||||||||||||||||||||
| 3rd week | 0.312±0.043 | 0.318±0.064 | 0.531 | 0.601 | 13.384±2.133 | 13.267±3.178 | 0.220 | 0.828 | |||||||||||||||||||||||||||||||||||||||||||||||||||||||||||||||||||||||||||||||||||||||||||
| 4th week | 0.310±0.078 | 0.330±0.166 | 0.653 | 0.521 | 11.960±3.022 | 10.970±2.388 | 1.446 | 0.165 | |||||||||||||||||||||||||||||||||||||||||||||||||||||||||||||||||||||||||||||||||||||||||||
| 5th week | 0.388±0.056 | 0.315±0.058 | 5.033 | <0.001* | 8.193±1.615 | 11.538±2.558 | 8.847 | <0.001* | |||||||||||||||||||||||||||||||||||||||||||||||||||||||||||||||||||||||||||||||||||||||||||
| 6th week | 0.425±0.062 | 0.330±0.043 | 6.849 | <0.001* | 8.057±1.095 | 11.474±1.754 | 9.240 | <0.001* | |||||||||||||||||||||||||||||||||||||||||||||||||||||||||||||||||||||||||||||||||||||||||||
| p*value is less than 0.05, which means there is a statistical difference. | |||||||||||||||||||||||||||||||||||||||||||||||||||||||||||||||||||||||||||||||||||||||||||||||||||
In contrast, for the T2* value, we found that there was no significant difference between the bilateral SNpc from the 1st to the 4th week. The value decreased significantly on the lesion side in the 5th and 6th week (Figure 1B). T2* values of the bilateral SNpc were statistically different in the 5th and 6th weeks. See Table 1 for details. Comparison of changes of FA and T2* value before and after surgery, see Supplementary Table 1 for details.
Receiver operating characteristic curve parameters for the FA and T2* values
We then used receiver operating characteristic (ROC) curves to analyze the FA values at 1st, 2nd, 5th, and 6th weeks and T2* values at the 5th and 6th weeks. ROC curve parameters for the diagnostic performance of FA and T2* values in the SNpc are shown in Table 2 and Figure 2A, 2B. Although there were no significant differences in the areas under the ROC curves (AUCs) in the 2nd week, they differed significantly at other times. The maximum AUC for the FA value in the 6th week was 0.907 (p < 0.0001), with a cut-off value, sensitivity, and specificity of 0.325, 100%, and 70%, respectively. The maximum AUC for the T2* value in the 6th week was 0.945, which suggested that this value was useful for detecting PD in the model rats (p < 0.0001), with a cut-off value, sensitivity, and specificity of 9.48, 90%, and 95%, respectively.
Table 2. Diagnostic performance of FA and T2* values.
| AUC (95% CI) | Cut-off value | Sensitivity (95% CI) | Specificity (95% CI) | p value | Youden’s index | ||||||||||||||||||||||||||||||||||||||||||||||||||||||||||||||||||||||||||||||||||||||||||||||
| FA at 1st week | 0.8063(0.6684-0.9441) | 0.2850 | 80.00(56.34-94.27) | 75.00(50.90-91.34) | 0.0009* | 0.55 | |||||||||||||||||||||||||||||||||||||||||||||||||||||||||||||||||||||||||||||||||||||||||||||
| FA at 2nd week | 0.6663(0.4961-0.8364) | 0.3250 | 45.00(23.06-68.47) | 85.00(62.11-96.79) | 0.07211 | 0.30 | |||||||||||||||||||||||||||||||||||||||||||||||||||||||||||||||||||||||||||||||||||||||||||||
| FA at 5th week | 0.8138(0.6838-0.9437) | 0.2950 | 50.00(27.20-72.80) | 100.00(83.16-100.0) | 0.0007* | 0.50 | |||||||||||||||||||||||||||||||||||||||||||||||||||||||||||||||||||||||||||||||||||||||||||||
| FA at 6th week | 0.9075(0.8164-0.9986) | 0.3950 | 100.00(83.16-100.0) | 70.00(45.72-88.11) | <0.0001* | 0.70 | |||||||||||||||||||||||||||||||||||||||||||||||||||||||||||||||||||||||||||||||||||||||||||||
| T2* at 5th week | 0.8600(0.7425-0.9775) | 9.310 | 75.00(50.90-91.34) | 85.00(62.11-96.79) | <0.0001* | 0.60 | |||||||||||||||||||||||||||||||||||||||||||||||||||||||||||||||||||||||||||||||||||||||||||||
| T2* at 6th week | 0.9450(0.8604-1.030) | 9.480 | 90.00(68.30-98.77) | 95.00(75.13-99.87) | <0.0001* | 0.85 | |||||||||||||||||||||||||||||||||||||||||||||||||||||||||||||||||||||||||||||||||||||||||||||
| *:There was statistical difference. | |||||||||||||||||||||||||||||||||||||||||||||||||||||||||||||||||||||||||||||||||||||||||||||||||||
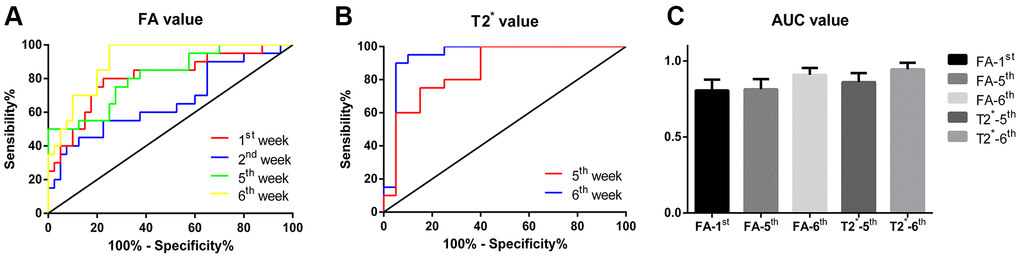
Figure 2. (A) The ROC curve of FA values at 1st, 2nd, 5th and 6th week respectively, the yellow broken line represents the curve of FA values at the 6th week, which is closest to the upper left corner, with the highest diagnostic efficiency; (B) The ROC curve of T2* values at 5th and 6th week respectively, the blue broken line represents the curve of T2* values at the 6th week, which is closest to the upper left corner and has the highest diagnostic efficiency. (C) Comparison of AUC of each subgroup, the results were not statistically different.
The AUCs of the FA and T2* values at the time-points showing statistically significant differences between the lesioned and non-lesioned SNpcs were compared, but no statistically significant difference was found among these AUCs (F = 1.054, p = 0.384), although the AUC value of the T2* value in the 6th week was the largest. Overall, the T2* value in the 6th week had the highest Youden index and thus the best diagnostic performance for detecting PD. The details are shown in Figure 2C.
Comparative study on glial fibrillary acidic protein and iron staining in the 6th week
In the 6th week, after the 6-OHDA injection, in comparison to the left SNpc (Figure 3B), there was distinct apoptosis of TH+-stained cells in the right SNpc (Figure 3A). The integrated optical density (IOD)/area of glial fibrillary acidic protein (GFAP) in the right SNpc (Figure 3D) was significantly higher than that of the equivalent contralateral area (t = 6.072, p < 0.0001) (Figure 3C, 3E). Additionally, the IOD/area of iron staining was increased significantly in the right SNpc as compared to the contralateral SNpc (t = 3.632, p = 0.0018) (Figure 3C, 3G, 3H).
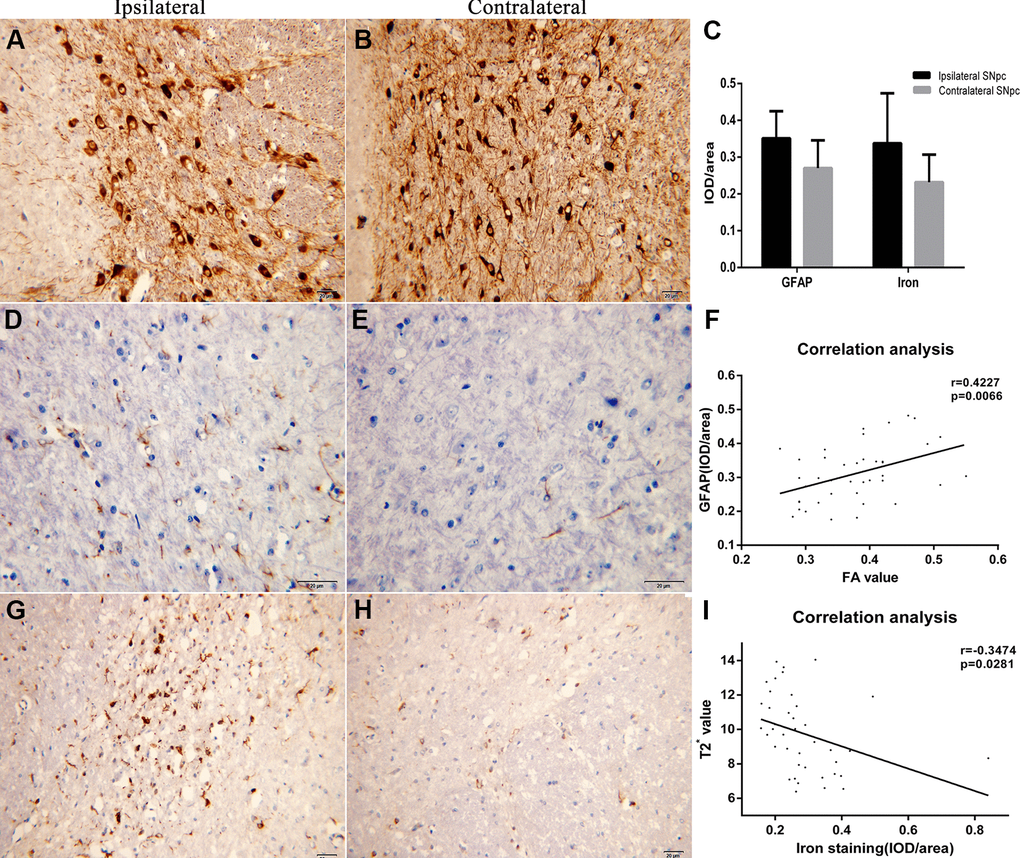
Figure 3. (A, B) The immunohistochemistry images of TH staining in ipsilateral and contralateral SNpc are displayed respectively. (C) It shows the comparison results of the IOD/area of GFAP and iron staining. (D, E) The immunohistochemistry images of GAFP staining in ipsilateral and contralateral SNpc are displayed respectively. (F) Correlation analysis between the FA values and IOD/area of GFAP. (G, H) The immunohistochemistry images of iron staining in ipsilateral and contralateral SNpc are displayed respectively. (I) Correlation analysis between the T2* values and IOD/area of iron staining.
Correlation analysis showed that the FA value correlated positively with the IOD/area of GFAP (r = 0.4227, 95% confidence interval [CI]: 0.1280 to 0.6488) (Figure 3F), while the T2* value correlated negatively with the IOD/area of iron staining (r = -0.3474, 95%CI: -0.0402 to -0.5945) (Figure 3I).
Discussion
Change trends in weekly FA and T2* values in the bilateral SNpc differ
The neurotoxin 6-OHDA has played a fundamental role in preclinical research on PD. 6-OHDA is a structural analogue of DA and exerts a toxic effects on DA neurons [27, 28]. The first model exploiting 6-OHDA neurotoxicity was developed in 1968 by Ungerstedt who injected the toxin bilaterally into the SN of the rat, obtaining an animal model of akinesia with a very high mortality rate [29]. Only subsequently was 6-OHDA injected unilaterally into the rat SN, to obtain the so called “6-OHDA Ungerstedt model” of rotation [29]. Since then, 6-OHDA had become one of the most widely used neurotoxins for modeling PD in experimental animals [29], including in the present study. And the SD rat PD model was a common rat model [9]. Moreover, SD rats were also easy to obtain, and the adaptability of SD rats was also strong, which were widely used in the preparation of nervous system models and can meet the requirements of this experiment. Therefore, the PD model of SD rats was adopted in this experiment [30].
DTI mainly uses the signal generated by the free movement of water molecules in different directions in the body [20]. It can detect microstructural changes in brain gray matter and white matter over time [31], and performs well in evaluating the relationship between tissue structure and pathological changes [32]. The FA value from DTI is a scalar value between 0 and 1 that describes the degree of anisotropy of a diffusion process [33]. Using FA, changes in brain microstructure can be found early on [34]. Furthermore, T2*WI can be created as a postexcitation refocused gradient echo sequence with small flip angle [35]. The sequence of gradient echo T2*WI requires a magnetic field with high uniformity [35]. When iron-containing compounds are deposited in the brain, the magnetic field uniformity changes, leading to a change in T2* value [23]. In the present study, we found that, after 6-OHDA was injected into the right SNpc of rats, the ipsilateral FA value decreased significantly in the 1st and 2nd weeks after operation, and then increased gradually over the next few weeks. The contralateral FA value essentially remained unchanged, every week. The ipsilateral FA value was significantly higher than that of the contralateral value in the 5th and 6th weeks. In contrast, the ipsilateral T2* value also showed a downward trend in the 5th and 6th week compared with the previous four weeks, while the contralateral T2* value scarcely changed from the 1st to the 6th week. This was similar to previously reported research results [26]. However, unlike our study, the previous results showed that there was no significant difference between the FA value of the SNpc in PD rats and the control group in the 2nd week. We consider that this discrepancy was related to the use of paired samples t-tests in this study. When using independent sample t-tests, there was no statistically significant difference between the bilateral FA values.
The reason for the differences in the weekly changes of FA and T2* values between the bilateral SNpc was that there was no mutual convection in brain intercellular fluid between the bilateral SNpc. When MRI contrast agent was injected into the SN, the contrast agent was used to show the movement of water molecules. MRI scanning monitored the flow direction of cerebrospinal fluid in the SN. The results showed that the cerebrospinal fluid in the injection contrast agent ipsilateral SN was directly cleared and drained into the subarachnoid cavity, rather than flowing to the contralateral SN [36–40]. Thus, unilateral injection of 6-OHDA into the SNpc did not cause damage to the contralateral SNpc DA neurons. By studying the changes in MR parameters of the bilateral SNpc in PD rats, this experiment not only reduced the number of experimental animals but was also less prone to confounding factors.
Bilateral FA values differ significantly in the 1st, 2nd, 5th, and 6th week
The experimental results show that the FA value of ipsilateral SNpc after injection was significantly lower than that of the contralateral SNpc in the 1st and 2nd week but was significantly higher than that of the contralateral SNpc in the 5th and 6th weeks. We considered that, in the early stage after 6-OHDA injection, a large number of DA neurons undergo apoptosis, resulting in the loss of neurons in the SNpc, which significantly reduced the anisotropy [26]. Previous studies showed that intracellular and extracellular α-syn aggregates were observed within 24 h [41], and DA neurons apoptosis occurred within 48 h after 6-OHDA injection in the brain [42]. Within 2 weeks after the drug injection, the damage to DA neurons stabilized, and the PD model was considered successful [43]. Glial cells also changed after injection of 6-OHDA. Activation of microglia appeared in the 1st week after the operation, and could last until the 4th week [44]. The activation of microglia can stimulate the activation of astrocytes and inhibit the damage of DA neurons, and thus may antagonize the decline of anisotropy to some extent. This may account for the lack of significant differences in FA values between the bilateral SNpc in the 3rd and 4th weeks. Astrocyte proliferation appeared in the 4th week [31, 43, 45]. The activation or proliferation of these glial cells can lead to a significant increase in FA values [31, 45]. The significantly higher FA value in the ipsilateral than in the contralateral SNpc in the 5th week in this study requires clarification. We consider that, at this time-point, DA neuron apoptosis and astrocyte activation reach a balanced state: DA neuron necrosis had stabilized, and astrocyte activation had become dominant, so that the FA value on the lesion side was significantly higher than that on the contralateral side in the 5th week. In addition, there was also a significant positive correlation between the FA value and the IOD/area of GFAP, indicating that the increase in FA value was related to astrocyte activation. Additionally, other studies had also shown that necrosis of DA neurons led to neuroinflammation in the SNpc and induced activation of astrocytes and microglia [46].
Bilateral T2* values differ significantly in the 5th and 6th weeks
We found that T2* values in the SNpc on the lesion side were significantly lower than that on the contralateral side in the 5th and 6th weeks. Previous studies demonstrated that it may be related to the change of local magnetic field uniformity caused by iron deposition in the brain after 6-OHDA damage, thus reducing T2* value [26]. Our experimental results showed that the intensity of iron deposition was negatively correlated with the change of T2* value. This confirms that 6-OHDA could lead to iron deposition, and ultimately lead to the decrease of T2* value. Additionally, previous studies showed that iron was observed in the SN of 6-OHDA-lesioned but not in Sham animals after the 4th week, confirming that the hypointensities present in the MRI images coincided with the presence of iron [45], while the T2* value on the lesion side can decrease significantly 4th weeks later [24]. Our experiment showed a significant decrease in the 5th week. Considering that the dose of 6-OHDA injected in our experiment was lower than that used by Virel et al. [24], the time of iron deposition may have been relatively delayed. Nevertheless, the mechanisms underlying this accumulation of iron are not yet fully understood. It might be owing to the misregulation of iron transporters or the capacity of 6-OHDA to release iron from ferritin [47]. Some studies have shown that 6-OHDA can activate iron regulatory protein 1 in DA neurons, up-regulating the expression of divalent metal transporter 1 and down-regulating ferroportin 1, resulting in the transport of iron into neurons and the creation of ferritin storage in neurons [48, 49]. Recent studies have found the presence of iron in DA neuronal vesicles that were transported through the axons. Therefore, iron can be transferred between neurons through vesicles and stored in neurons [50]. Thus, when injected with 6-OHDA, dopamine neurons are apoptotic, and ferritin-bound iron or vesicular iron released from degenerated DA fibers will lead to iron deposition in SN. On the other hand, iron could cross the blood–brain barrier though endocytosis of holo-transferrin, followed by iron detached from transferrin inside endosomes, and ferroportin1-mediated iron efflux or transcytosis of holo-transferrin through the brain capillary endothelial cells. Another mechanism involves a correlation between iron deposition in the brain and the activation of astrocytes and microglia [51, 52]. First, astrocytes could take Fe3+ up via the transferrin/transferrin receptor 1, the divalent metal transporter 1, Zrt/Irt-like protein 14, and resident transient receptor potential channel also participate in iron absorption [48]. Second, iron could be transported via divalent metal transporter 1-mediated iron import and ferroportin 1-mediated iron export. Microglia can also transfer Fe3+ ions to DA neurons by the lactoferrin/lactoferrin receptor-mediated pathway and store iron in ferritin [48]. See the left half of Figure 4 for the detailed pathological changes.
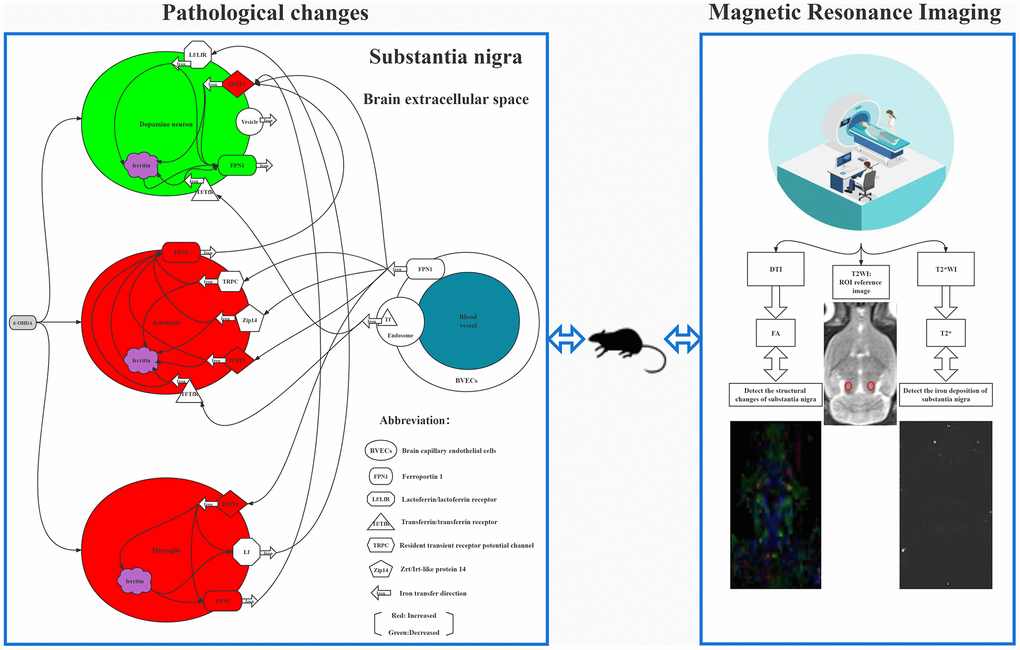
Figure 4. The left half of figure shows 6-OHDA induced cytological changes and iron deposition, it shows that 6-OHDA can induce dopamine neuron apoptosis, glial cell activation, and the expression of many transferrin on cell membrane, which can specifically induce iron ion to be transported from blood to brain cells and stored, leading to iron deposition in SNpc. The right half shows FA and T2* mapping images. The T2WI image in the middle is the reference image for measuring FA and T2* values, and the small red circle in the figure is the position of the ROI.
Diagnostic efficiency of FA and T2* value is relatively better in the 6th week
We found that the diagnostic efficacy of the bilateral T2* value for PD rats was the highest in the 6th week, followed by that of the FA value in the 6th week. Youden’s index was 0.85 and 0.70, and the corresponding AUC were 0.945 and 0.907 respectively, indicating that the diagnostic efficiency was relatively good. We can surmise two reasons for the slightly worse diagnostic efficiency of the FA than that of the T2* value. After injecting 6-OHDA into the SNpc, changes occur in DA neurons, astrocytes, and microglia, and the changes in these cells can cause iron deposition in the SNpc [53]. A superposition effect may also be involved. In addition, FA values reflect changes in the microstructure of the brain, in principle [20]. Although the brain tissue was mainly composed of cellular components, the extracellular matrix is another major brain tissue component [38]. Therefore, FA values will be affected not only by changes in cellular components, but also by changes in extracellular microstructure [37]. The magnitude of the T2* value is related to the uniformity of the surrounding magnetic field. When iron deposition occurs after the onset of PD, the magnetic field uniformity of the SNpc is reduced and less interference factors were affected [22, 23, 35]. Thus, the diagnostic efficacy of T2* was the highest in the 6th week.
In conclusion, DTI and T2*WI have important diagnostic value in the early diagnosis of PD in a rat model. These modalities can be used to screen the early PD rat model in clinical experiments; In addition, we show that the diagnostic efficiency of both FA and T2* values was relatively better in the 6th week than before this time-point. Furthermore, T2*WI performed better than DTI in the diagnosis of early PD in the rat model. In other words, the best time to diagnose early PD in the 6-OHDA-induced rat model was at week 6, and when screening PD rat models, the application of T2* value may be the better choice.
Materials and Methods
Animals and surgery
All experiments were performed on mature (7-week-old; 200–250 g) male, SD rats (n = 20) (Beijing Vital River Laboratory Animal Technology Co., Ltd. China). The experiments were conducted in accordance with National Guidelines for the Use of Experimental Animals. All Experimental protocols were approved by the Ethics Committee of Qinhuangdao Municipal No.1 Hospital (202101A141). Every effort of animals used and their suffering. The rats were housed in a temperature (22 ± 2° C) and humidity-controlled (60 ± 5%) room, with a 12-h light/dark cycle, and with access to food and water ad libitum.
The surgical procedures and rotation test that were used for induction and assessment of the PD model followed the protocols of Fang et al. (2018). All rats were subjected to the modeling process [54]. First, the rat was anesthetized using 10% chloral hydrate by intraperitoneal injection, at an initial dose of 3 ml/kg, and with a maintenance dose of 2 ml/kg/h for the duration of the operation. The rat was mounted into a stereotactic apparatus (Lab Standard Stereotaxic-Single, Stoelting Co, Wood Dale, IL, USA). The bregma was exposed, an incision was made on the scalp along the sagittal suture, and a small trephine hole was drilled in accordance with the stereotactic coordinates of the right SNpc (relative to bregma: anterioposterior, −4.8 mm; mediolateral, 1.9 mm; dorsoventral, −8.0 mm from the skull). We chose coordinate points according to Paxinos’ Rat Brain in Stereotaxic Coordinates, Compact, Third Edition [55]. Using a microsyringe (Hamilton Bonaduz AG, Bonaduz, Switzerland), 6 μl of 6-OHDA solution (2 μg/μl in normal saline containing 0.2% ascorbate; Sigma Chemical Co., St. Louis, MO, USA) was automatically infused into the right SNpc of all 20 rats. Although this drug can also cause serious damage to noradrenergic neurons, we did not attempt to protect the noradrenergic neurons before injecting 6-OHDA [56] as such measures would have increased the burden on the rats. In addition, we considered that the loss of noradrenergic neurons due to 6-OHDA would have little effect on the experimental results. The needle was kept in place for 5 min after completion of the injection and was then slowly withdrawn. The scalp was sutured closed, and intramuscular antibiotics were administered to prevent infection.
Apomorphine-induced rotation test
All rats received a single intraperitoneal injection of apomorphine (0.5 mg/kg in normal saline) at the beginning of every week after surgery. For the rotation test, animals were allowed to habituate to the test apparatus for 10 min and then for an additional 2 min after the injection. Full rotations were counted in a cylindrical container in a dimly lit quiet room. Rotational asymmetry was continuously scored for 30 min and then complete contralateral rotation times were scored. The rotations times were observed and recorded in real time. In the above rotation experiments, the rat model was considered successful if at least one experimental result exceeded 7 rotations/min.
MRI
Anesthesia was performed as described above, and the rats were scanned using a 3.0-T MRI system (Verio, Siemens Medical Solutions, Erlangen, Germany) with an eight-channel coil (Teshen Electric Co., Ltd, Shenzhen, China). Detailed MRI scanning parameters were as follows: Axial T2WI turbo spin-echo (TSE) (repetition time [TR]/echo time [TE] 3000/113 ms, flip angle = 150°, field-of-view [FOV] 74 × 74 mm, average = 14, voxel size = 0.3 × 0.3 × 2.0 mm, slice thickness = 2.0 mm, number of slices = 10). Transverse T2-weighted TSE (TR/TE 4,000/111 ms, flip angle = 150°, average = 10, FOV = 70 × 70 mm, voxel size = 0.4 × 0.3 × 1.0 mm, slice thickness = 2.0 mm, number of slices = 12). Single-shot spin-echo echo-planar imaging was used for DTI. Fast low-angle shot 2D T2WI (FLASH 2D T2WI) was used to acquire T2* maps. Scan layers were aligned parallel to the anterior/posterior line with the following settings. DTI: TR/TE 1800/110 ms, FOV = 65 × 65mm, slice thickness = 2 mm, voxel size = 1.5 × 1.0 × 2.0 mm, sensitivity-encoding (SENSE) factor = 2, 15 nonlinear directions, b-parameter of 0 and 1,000 s/mm2, respectively. To increase the signal-to-noise ratio, scanning was repeated nine times. FLASH 2D T2WI: TR = 4,000, TE = 15/30/45/60 ms, FOV = 65 × 65 mm, slice thickness = 2 mm, voxel size = 1.5 × 1.0 × 2.0 mm. To increase the signal-to-noise ratio, scanning was repeated nine times (total scanning time = 17 min 38 s).
During MRI, the rat’s head was immobilized with a custom-made MRI-compatible head holder (the polyethylene barrel fixator can firmly fix the rat brain in the MR coil). The image quality was analyzed immediately after the MR scan was completed. If the rat’s head moved during the MR scan, it was repeated 2 h later with an additional anesthetic as needed. Imaging analysis was carried out using prototype software on a workstation (Siemens Verio 3.0 T MR Leonardo 3682).
Using the T2W image as a reference, both SNpc areas could be identified on the FA and T2* parameter map images, and the above scanning parameters were used to scan the SNpc area. Scans were performed in the 1st, 2nd, 3rd, 4th, 5th, and 6th weeks after 6-OHDA lesion. Two independent radiologists, experienced in neural MRI analysis and who were blinded to the animal groups, indicated regions-of-interest, measuring 0.30–0.60 cm2 in the center of the SNpc on both sides of the brain. The mean values of the repeated measurements taken in the SNpc were used in the final analysis. See Figure 4 for MR images.
Immunohistochemistry and histochemistry
After MRI scans, the 20 rats were anesthetized again using 3 ml/kg 10% chloral hydrate by intraperitoneal injection. After perfusion, the brain was quickly removed, postfixed with 4% paraformaldehyde, and then embedded in paraffin. Eight-micrometer thick coronal vibratome sections, through the ventral mesencephalon, were cut from each brain. The SNpc sections were selected for immunohistochemistry, and all the sections from the different rat brains were matched as closely as possible. The slides were dewaxed using xylene, rehydrated in an alcohol gradient, incubated with a 1% citrate buffer in 0.1% Triton X100, and then washed with PBS solution for 8 min to unmask the antigens [57]. Immunohistochemistry for TH and GFAP was performed by overnight incubation with the appropriate primary antibody (rabbit polyclonal to TH, ab117112; rabbit monoclonal to GFAP, ab207165; Abcam, Cambridge, UK) at 4° C. Sections were next incubated with secondary antibody (Goat Anti-Rabbit IgG H&L, ab150078, Abcam, Cambridge, UK) for 30 min at 37° C. Sections were visualized with 3,3’-diaminobenzidine, and nuclei were counterstained with hematoxylin and eosin. Transverse frozen sections (5 μm) were dried in an oven at 60° C for 30–60 min and then soaked overnight in a 1:1 mixture of alcohol and chloroform in the dark, at 22 ± 1° C. Sections were rehydrated on the following day and stained with 0.1% cresyl violet solution (Sigma) for 5 min. Differentiation, dehydration, and rinsing were performed as described previously. Finally, sections were mounted with Permount (Beyotime Institute of Biotechnology, Shanghai, China). Histochemical staining for iron hematoxylin was carried out on additional sections, as described by Zhang et al. (2014). Sections were processed through a series of graded alcohols, into xylene, and rehydrated back to water. Sections were incubated in a 1:1 solution of 2% HCl and potassium ferrocyanide (Sigma–Aldrich) for 30 min and rinsed in water. Sections were counterstained with Neutral Red, dehydrated in increasing concentrations of ethanol, cleared in xylene, and mounted on slides [58].
The intensity of GFAP- and iron-positive staining in tissue sections was analyzed by IOD using the Image-Pro Plus 6.0 software (NIH, Bethesda, MD, USA) as described previously [59], with minor modification. Forty TIFF-format images, all from approximately the same SN location on both sides of all 20 rats, were blindly analyzed. All of the images were taken using the same microscope and camera sets (Eclipse 80i, Nikon, Chiyoda, Japan). Image-Pro Plus software was used to calculate the average IOD per stained area (μm2) (IOD/area) for positive staining [60].
Statistical analysis
The data were analyzed using a commercial statistical software package (SPSS21.0, Chicago, IL, USA). The results were presented as mean ± standard deviation. The paired t-test was used to determine the differences in FA and T2* values of bilateral SNpc every week. ROC curves were constructed to assess the paired t-test data indicating statistically significant differences. The cut-off values for ROC analysis were chosen as the point maximizing Youden’s index). FA and T2* parameters were entered into multiple logistic regression models to determine AUCs for combinations of models to evaluate diagnostic performance. The AUC values of multiple groups were compared by one-way analysis of variance, and an inter-group comparison was made using the least significant difference (LSD) method. Pearson correlation analysis was employed to assess the correlation of the IOD/area of GFAP, and iron staining density with the MRI parameters. P values < 0.05 were considered statistically significant for all analyses.
Abbreviations
AUC: area under the ROC curve; CI: confidence interval; DA: dopamine; DTI: diffusion tensor imaging; FA: fractional anisotropy; FLASH: Fast low-angle shot; FOV: field-of-view; GFAP: glial fibrillary acidic protein; IOD: integrated optical density; MRI: magnetic resonance imaging; PD: Parkinson’s disease; ROC: receiver operating characteristic; SNpc: substantia nigra pars compacta; TE: echo time; TH: tyrosine hydroxylase; TR: repetition time; TSE: turbo spin-echo.
Author Contributions
YC D, DF L, and LX L contributed to the design of the study and the development of the study protocol, ZQ W performed the experiments, and T Z coordinated the study. ZQ W and LX L performed the systematic review, including data collection and data analysis. All authors contributed to data interpretation, manuscript drafting and review. YC D drafted the first version of the manuscript.
Conflicts of Interest
The authors had no conflicts of interest to declare.
Funding
This research was supported by the Qinhuangdao Science-Technology Support Projects of China (202101A141).
References
- 1. Hayes MT. Parkinson’s Disease and Parkinsonism. Am J Med. 2019; 132:802–7. https://doi.org/10.1016/j.amjmed.2019.03.001 [PubMed]
- 2. Dutkiewicz J, Szlufik S, Friedman A. “New methods of assessing autonomic disorders in Parkinson disease patients: skin-galvanic reaction”. J Neural Transm (Vienna). 2019; 126:1421–4. https://doi.org/10.1007/s00702-019-02060-6 [PubMed]
- 3. Rosa I, Di Censo D, Ranieri B, Di Giovanni G, Scarnati E, Alecci M, Galante A, Florio TM. Comparison between Tail Suspension Swing Test and Standard Rotation Test in Revealing Early Motor Behavioral Changes and Neurodegeneration in 6-OHDA Hemiparkinsonian Rats. Int J Mol Sci. 2020; 21:2874. https://doi.org/10.3390/ijms21082874 [PubMed]
- 4. Khairnar A, Ruda-Kucerova J, Arab A, Hadjistyllis C, Sejnoha Minsterova A, Shang Q, Chovsepian A, Drazanova E, Szabó N, Starcuk Z
Jr , Rektorova I, Pan-Montojo F. Diffusion kurtosis imaging detects the time-dependent progress of pathological changes in the oral rotenone mouse model of Parkinson’s disease. J Neurochem. 2021; 158:779–97. https://doi.org/10.1111/jnc.15449 [PubMed] - 5. Kouli A, Torsney KM, Kuan WL. Parkinson’s Disease: Etiology, Neuropathology, and Pathogenesis. In: Stoker TB, Greenland JC, editors. Parkinson’s Disease: Pathogenesis and Clinical Aspects. Brisbane (AU): Codon Publications; 2018. https://doi.org/10.15586/codonpublications.parkinsonsdisease.2018.ch1 [PubMed]
- 6. Martinez-Martin P, Skorvanek M, Rojo-Abuin JM, Gregova Z, Stebbins GT, Goetz CG, and members of the QUALPD Study Group. Validation study of the hoehn and yahr scale included in the MDS-UPDRS. Mov Disord. 2018; 33:651–2. https://doi.org/10.1002/mds.27242 [PubMed]
- 7. Lu M, Zhao Q, Poston KL, Sullivan EV, Pfefferbaum A, Shahid M, Katz M, Kouhsari LM, Schulman K, Milstein A, Niebles JC, Henderson VW, Fei-Fei L, et al. Quantifying Parkinson’s disease motor severity under uncertainty using MDS-UPDRS videos. Med Image Anal. 2021; 73:102179. https://doi.org/10.1016/j.media.2021.102179 [PubMed]
- 8. Mantri S, Duda JE, Morley JF. Early and Accurate Identification of Parkinson Disease Among US Veterans. Fed Pract. 2019 (Suppl 4); 36:S18–23. [PubMed]
- 9. Ji F, Zhu Z, Zhang M, Zhang H, Zhu L, Cai X, Liu W, Song J, Li M, Cai Z. 6-OH-BDE-47 exposure-induced Parkinson’s disease pathology in Sprague Dawley rat. Sci Total Environ. 2020; 711:135184. https://doi.org/10.1016/j.scitotenv.2019.135184 [PubMed]
- 10. Thiele SL, Warre R, Nash JE. Development of a unilaterally-lesioned 6-OHDA mouse model of Parkinson’s disease. J Vis Exp. 2012; 3234. https://doi.org/10.3791/3234 [PubMed]
- 11. Sun C, Jia G, Wang X, Wang Y, Liu Y. Immunoproteasome is up-regulated in rotenone-induced Parkinson’s disease rat model. Neurosci Lett. 2020; 738:135360. https://doi.org/10.1016/j.neulet.2020.135360 [PubMed]
- 12. Antipova V, Hawlitschka A, Mix E, Schmitt O, Dräger D, Benecke R, Wree A. Behavioral and structural effects of unilateral intrastriatal injections of botulinum neurotoxin a in the rat model of Parkinson’s disease. J Neurosci Res. 2013; 91:838–47. https://doi.org/10.1002/jnr.23210 [PubMed]
- 13. Tugba EK, Medine GIO, Ozlem A, Deniz K, Filiz OY. Prolongation of absence seizures and changes in serotonergic and dopaminergic neurotransmission by nigrostriatal pathway degeneration in genetic absence epilepsy rats. Pharmacol Biochem Behav. 2022; 213:173317. https://doi.org/10.1016/j.pbb.2021.173317 [PubMed]
- 14. Kansara S, Trivedi A, Chen S, Jankovic J, Le W. Early diagnosis and therapy of Parkinson’s disease: can disease progression be curbed? J Neural Transm (Vienna). 2013; 120:197–210. https://doi.org/10.1007/s00702-012-0840-9 [PubMed]
- 15. Akdemir ÜÖ, Bora Tokçaer A, Atay LÖ. Dopamine transporter SPECT imaging in Parkinson’s disease and parkinsonian disorders. Turk J Med Sci. 2021; 51:400–10. https://doi.org/10.3906/sag-2008-253 [PubMed]
- 16. Walker Z, Gandolfo F, Orini S, Garibotto V, Agosta F, Arbizu J, Bouwman F, Drzezga A, Nestor P, Boccardi M, Altomare D, Festari C, Nobili F, and EANM-EAN Task Force for the recommendation of FDG PET for Dementing Neurodegenerative Disorders. Clinical utility of FDG PET in Parkinson’s disease and atypical parkinsonism associated with dementia. Eur J Nucl Med Mol Imaging. 2018; 45:1534–45. https://doi.org/10.1007/s00259-018-4031-2 [PubMed]
- 17. Verger A, Grimaldi S, Ribeiro MJ, Frismand S, Guedj E. Single Photon Emission Computed Tomography/Positron Emission Tomography Molecular Imaging for Parkinsonism: A Fast-Developing Field. Ann Neurol. 2021; 90:711–9. https://doi.org/10.1002/ana.26187 [PubMed]
- 18. Ryman SG, Poston KL. MRI biomarkers of motor and non-motor symptoms in Parkinson’s disease. Parkinsonism Relat Disord. 2020; 73:85–93. https://doi.org/10.1016/j.parkreldis.2019.10.002 [PubMed]
- 19. Alster P, Nieciecki M, Migda B, Kutyłowski M, Madetko N, Duszyńska-Wąs K, Charzyńska I, Koziorowski D, Królicki L, Friedman A. The Strengths and Obstacles in the Differential Diagnosis of Progressive Supranuclear Palsy-Parkinsonism Predominant (PSP-P) and Multiple System Atrophy (MSA) Using Magnetic Resonance Imaging (MRI) and Perfusion Single Photon Emission Computed Tomography (SPECT). Diagnostics (Basel). 2022; 12:385. https://doi.org/10.3390/diagnostics12020385 [PubMed]
- 20. Zhang Y, Burock MA. Diffusion Tensor Imaging in Parkinson's Disease and Parkinsonian Syndrome: A Systematic Review. Front Neurol. 2020; 11:531993. https://doi.org/10.3389/fneur.2020.531993 [PubMed]
- 21. Su RJ, Zhen JL, Wang W, Zhang JL, Zheng Y, Wang XM. Time-course behavioral features are correlated with Parkinson’s disease-associated pathology in a 6-hydroxydopamine hemiparkinsonian rat model. Mol Med Rep. 2018; 17:3356–63. https://doi.org/10.3892/mmr.2017.8277 [PubMed]
- 22. Liu LX, Du D, Wang ZQ, Fang Y, Zheng T, Dong YC, Shi QL, Zhao M, Xiao F, Du J. Differences in brain pathological changes between rotenone and 6-hydroxydopamine Parkinson’s disease models. Neural Regen Res. 2018; 13:1276–80. https://doi.org/10.4103/1673-5374.235076 [PubMed]
- 23. Fang Y, Zheng T, Liu L, Gao D, Shi Q, Dong Y, Du D. Role of the combination of FA and T2* parameters as a new diagnostic method in therapeutic evaluation of Parkinson’s disease. J Magn Reson Imaging. 2018; 48:84–93. https://doi.org/10.1002/jmri.25900 [PubMed]
- 24. Virel A, Faergemann E, Orädd G, Strömberg I. Magnetic resonance imaging (MRI) to study striatal iron accumulation in a rat model of Parkinson’s disease. PLoS One. 2014; 9:e112941. https://doi.org/10.1371/journal.pone.0112941 [PubMed]
- 25. Liu LX, Du D, Zheng T, Fang Y, Chen YS, Yi HL, He QY, Gao DW, Shi QL. Detecting dopaminergic neuronal degeneration using diffusion tensor imaging in a rotenone-induced rat model of Parkinson’s disease: fractional anisotropy and mean diffusivity values. Neural Regen Res. 2017; 12:1485–91. https://doi.org/10.4103/1673-5374.213559 [PubMed]
- 26. Dong Y, Liu D, Zhao Y, Yuan Y, Wang W, Wu S, Liang X, Wang Z, Liu L. Assessment of Neuroprotective Effects of Low-Intensity Transcranial Ultrasound Stimulation in a Parkinson's Disease Rat Model by Fractional Anisotropy and Relaxation Time T2* Value. Front Neurosci. 2021; 15:590354. https://doi.org/10.3389/fnins.2021.590354 [PubMed]
- 27. Wree A, Mix E, Hawlitschka A, Antipova V, Witt M, Schmitt O, Benecke R. Intrastriatal botulinum toxin abolishes pathologic rotational behaviour and induces axonal varicosities in the 6-OHDA rat model of Parkinson’s disease. Neurobiol Dis. 2011; 41:291–8. https://doi.org/10.1016/j.nbd.2010.09.017 [PubMed]
- 28. Mehlan J, Brosig H, Schmitt O, Mix E, Wree A, Hawlitschka A. Intrastriatal injection of botulinum neurotoxin-A is not cytotoxic in rat brain - A histological and stereological analysis. Brain Res. 2016; 1630:18–24. https://doi.org/10.1016/j.brainres.2015.10.056 [PubMed]
- 29. Simola N, Morelli M, Carta AR. The 6-hydroxydopamine model of Parkinson’s disease. Neurotox Res. 2007; 11:151–67. https://doi.org/10.1007/BF03033565 [PubMed]
- 30. Kunze A, Zierath D, Drogomiretskiy O, Becker K. Variation in behavioral deficits and patterns of recovery after stroke among different rat strains. Transl Stroke Res. 2014; 5:569–76. https://doi.org/10.1007/s12975-014-0337-y [PubMed]
- 31. Zhang W, Zhang L, Liu L, Wang X. Time course study of fractional anisotropy in the substantia nigra of a parkinsonian rat model induced by 6-OHDA. Behav Brain Res. 2017; 328:130–7. https://doi.org/10.1016/j.bbr.2017.03.046 [PubMed]
- 32. Manenti G, Carlani M, Mancino S, Colangelo V, Di Roma M, Squillaci E, Simonetti G. Diffusion tensor magnetic resonance imaging of prostate cancer. Invest Radiol. 2007; 42:412–9. https://doi.org/10.1097/01.rli.0000264059.46444.bf [PubMed]
- 33. Alexander AL, Lee JE, Lazar M, Field AS. Diffusion tensor imaging of the brain. Neurotherapeutics. 2007; 4:316–29. https://doi.org/10.1016/j.nurt.2007.05.011 [PubMed]
- 34. Vaillancourt DE, Spraker MB, Prodoehl J, Abraham I, Corcos DM, Zhou XJ, Comella CL, Little DM. High-resolution diffusion tensor imaging in the substantia nigra of de novo Parkinson disease. Neurology. 2009; 72:1378–84. https://doi.org/10.1212/01.wnl.0000340982.01727.6e [PubMed]
- 35. Chavhan GB, Babyn PS, Thomas B, Shroff MM, Haacke EM. Principles, techniques, and applications of T2*-based MR imaging and its special applications. Radiographics. 2009; 29:1433–49. https://doi.org/10.1148/rg.295095034 [PubMed]
- 36. Han H, Shi C, Fu Y, Zuo L, Lee K, He Q, Han H. A novel MRI tracer-based method for measuring water diffusion in the extracellular space of the rat brain. IEEE J Biomed Health Inform. 2014; 18:978–83. https://doi.org/10.1109/JBHI.2014.2308279 [PubMed]
- 37. Lv D, Li J, Li H, Fu Y, Wang W. Imaging and Quantitative Analysis of the Interstitial Space in the Caudate Nucleus in a Rotenone-Induced Rat Model of Parkinson’s Disease Using Tracer-based MRI. Aging Dis. 2017; 8:1–6. https://doi.org/10.14336/AD.2016.0625 [PubMed]
- 38. Wang W, He Q, Hou J, Chui D, Gao M, Wang A, Han H, Liu H. Stimulation Modeling on Three-Dimensional Anisotropic Diffusion of MRI Tracer in the Brain Interstitial Space. Front Neuroinform. 2019; 13:6. https://doi.org/10.3389/fninf.2019.00006 [PubMed]
- 39. Hou J, Wang W, Quan X, Liang W, Li Z, Chen D, Han H. Quantitative Visualization of Dynamic Tracer Transportation in the Extracellular Space of Deep Brain Regions Using Tracer-Based Magnetic Resonance Imaging. Med Sci Monit. 2017; 23:4260–8. https://doi.org/10.12659/msm.903010 [PubMed]
- 40. Wang A, Wang R, Cui D, Huang X, Yuan L, Liu H, Fu Y, Liang L, Wang W, He Q, Shi C, Guan X, Teng Z, et al. The Drainage of Interstitial Fluid in the Deep Brain is Controlled by the Integrity of Myelination. Aging Dis. 2019; 10:937–48. https://doi.org/10.14336/AD.2018.1206 [PubMed]
- 41. Wei X, He S, Wang Z, Wu J, Zhang J, Cheng Y, Yang J, Xu X, Chen Z, Ye J, Chen L, Lin L, Xiao J. Fibroblast growth factor 1attenuates 6-hydroxydopamine-induced neurotoxicity: an in vitro and in vivo investigation in experimental models of Parkinson’s disease. Am J Transl Res. 2014; 6:664–77. [PubMed]
- 42. Callizot N, Combes M, Henriques A, Poindron P. Necrosis, apoptosis, necroptosis, three modes of action of dopaminergic neuron neurotoxins. PLoS One. 2019; 14:e0215277. https://doi.org/10.1371/journal.pone.0215277 [PubMed]
- 43. Van Camp N, Blockx I, Verhoye M, Casteels C, Coun F, Leemans A, Sijbers J, Baekelandt V, Van Laere K, Van der Linden A. Diffusion tensor imaging in a rat model of Parkinson’s disease after lesioning of the nigrostriatal tract. NMR Biomed. 2009; 22:697–706. https://doi.org/10.1002/nbm.1381 [PubMed]
- 44. Depino AM, Earl C, Kaczmarczyk E, Ferrari C, Besedovsky H, del Rey A, Pitossi FJ, Oertel WH. Microglial activation with atypical proinflammatory cytokine expression in a rat model of Parkinson’s disease. Eur J Neurosci. 2003; 18:2731–42. https://doi.org/10.1111/j.1460-9568.2003.03014.x [PubMed]
- 45. Olmedo-Díaz S, Estévez-Silva H, Orädd G, Af Bjerkén S, Marcellino D, Virel A. An altered blood-brain barrier contributes to brain iron accumulation and neuroinflammation in the 6-OHDA rat model of Parkinson’s disease. Neuroscience. 2017; 362:141–51. https://doi.org/10.1016/j.neuroscience.2017.08.023 [PubMed]
- 46. Wang Q, Liu Y, Zhou J. Neuroinflammation in Parkinson’s disease and its potential as therapeutic target. Transl Neurodegener. 2015; 4:19. https://doi.org/10.1186/s40035-015-0042-0 [PubMed]
- 47. Lv Z, Jiang H, Xu H, Song N, Xie J. Increased iron levels correlate with the selective nigral dopaminergic neuron degeneration in Parkinson’s disease. J Neural Transm (Vienna). 2011; 118:361–9. https://doi.org/10.1007/s00702-010-0434-3 [PubMed]
- 48. Xu M, Li Y, Meng D, Zhang D, Wang B, Xie J, Wang J. 6-Hydroxydopamine Induces Abnormal Iron Sequestration in BV2 Microglia by Activating Iron Regulatory Protein 1 and Inhibiting Hepcidin Release. Biomolecules. 2022; 12:266. https://doi.org/10.3390/biom12020266 [PubMed]
- 49. Jiang H, Song N, Xu H, Zhang S, Wang J, Xie J. Up-regulation of divalent metal transporter 1 in 6-hydroxydopamine intoxication is IRE/IRP dependent. Cell Res. 2010; 20:345–56. https://doi.org/10.1038/cr.2010.20 [PubMed]
- 50. Ortega R, Cloetens P, Devès G, Carmona A, Bohic S. Iron storage within dopamine neurovesicles revealed by chemical nano-imaging. PLoS One. 2007; 2:e925. https://doi.org/10.1371/journal.pone.0000925 [PubMed]
- 51. He N, Ghassaban K, Huang P, Jokar M, Wang Y, Cheng Z, Jin Z, Li Y, Sethi SK, He Y, Chen Y, Gharabaghi S, Chen S, et al. Imaging iron and neuromelanin simultaneously using a single 3D gradient echo magnetization transfer sequence: Combining neuromelanin, iron and the nigrosome-1 sign as complementary imaging biomarkers in early stage Parkinson’s disease. Neuroimage. 2021; 230:117810. https://doi.org/10.1016/j.neuroimage.2021.117810 [PubMed]
- 52. Zhu Y, Wang B, Tao K, Yang H, Wang Y, Zhou T, Yang Y, Yuan L, Liu X, Duan Y. Iron accumulation and microglia activation contribute to substantia nigra hyperechogenicity in the 6-OHDA-induced rat model of Parkinson’s disease. Parkinsonism Relat Disord. 2017; 36:76–82. https://doi.org/10.1016/j.parkreldis.2017.01.003 [PubMed]
- 53. Zhang HY, Song N, Jiang H, Bi MX, Xie JX. Brain-derived neurotrophic factor and glial cell line-derived neurotrophic factor inhibit ferrous iron influx via divalent metal transporter 1 and iron regulatory protein 1 regulation in ventral mesencephalic neurons. Biochim Biophys Acta. 2014; 1843:2967–75. https://doi.org/10.1016/j.bbamcr.2014.09.010 [PubMed]
- 54. Fang Y, Dong Y, Zheng T, Du D, Wen J, Gao D, Liu L. Altered Tracer Distribution and Clearance in the Extracellular Space of the Substantia Nigra in a Rodent Model of Parkinson’s Disease. Front Neurosci. 2017; 11:409. https://doi.org/10.3389/fnins.2017.00409 [PubMed]
- 55. Paxinos G, Watson C. The Rat Brain in Stereotaxic Coordinates, Compact Third Edition (with CD-ROM). Rat Brain in Stereotaxic Coordinates. 1997; 3:6.
- 56. Lindgren HS, Demirbugen M, Bergqvist F, Lane EL, Dunnett SB. The effect of additional noradrenergic and serotonergic depletion on a lateralised choice reaction time task in rats with nigral 6-OHDA lesions. Exp Neurol. 2014; 253:52–62. https://doi.org/10.1016/j.expneurol.2013.11.015 [PubMed]
- 57. Ren R, Shi C, Cao J, Sun Y, Zhao X, Guo Y, Wang C, Lei H, Jiang H, Ablat N, Xu J, Li W, Ma Y, et al. Neuroprotective Effects of A Standardized Flavonoid Extract of Safflower Against Neurotoxin-Induced Cellular and Animal Models of Parkinson’s Disease. Sci Rep. 2016; 6:22135. https://doi.org/10.1038/srep22135 [PubMed]
- 58. Zhang Z, Hou L, Song JL, Song N, Sun YJ, Lin X, Wang XL, Zhang FZ, Ge YL. Pro-inflammatory cytokine-mediated ferroportin down-regulation contributes to the nigral iron accumulation in lipopolysaccharide-induced Parkinsonian models. Neuroscience. 2014; 257:20–30. https://doi.org/10.1016/j.neuroscience.2013.09.037 [PubMed]
- 59. Fang M, Yao M, Yang JL, Wang L, Sun JY, Wu MN, Yao DF, Tai BJ. [Quantitative detection and clinical value of CD44 in patients with nonalcoholic fatty liver disease]. Zhonghua Gan Zang Bing Za Zhi. 2019; 27:994–1000. https://doi.org/10.3760/cma.j.issn.1007-3418.2019.12.012 [PubMed]
- 60. Jia XL, Li SY, Dang SS, Cheng YA, Zhang X, Wang WJ, Hughes CE, Caterson B. Increased expression of chondroitin sulphate proteoglycans in rat hepatocellular carcinoma tissues. World J Gastroenterol. 2012; 18:3962–76. https://doi.org/10.3748/wjg.v18.i30.3962 [PubMed]