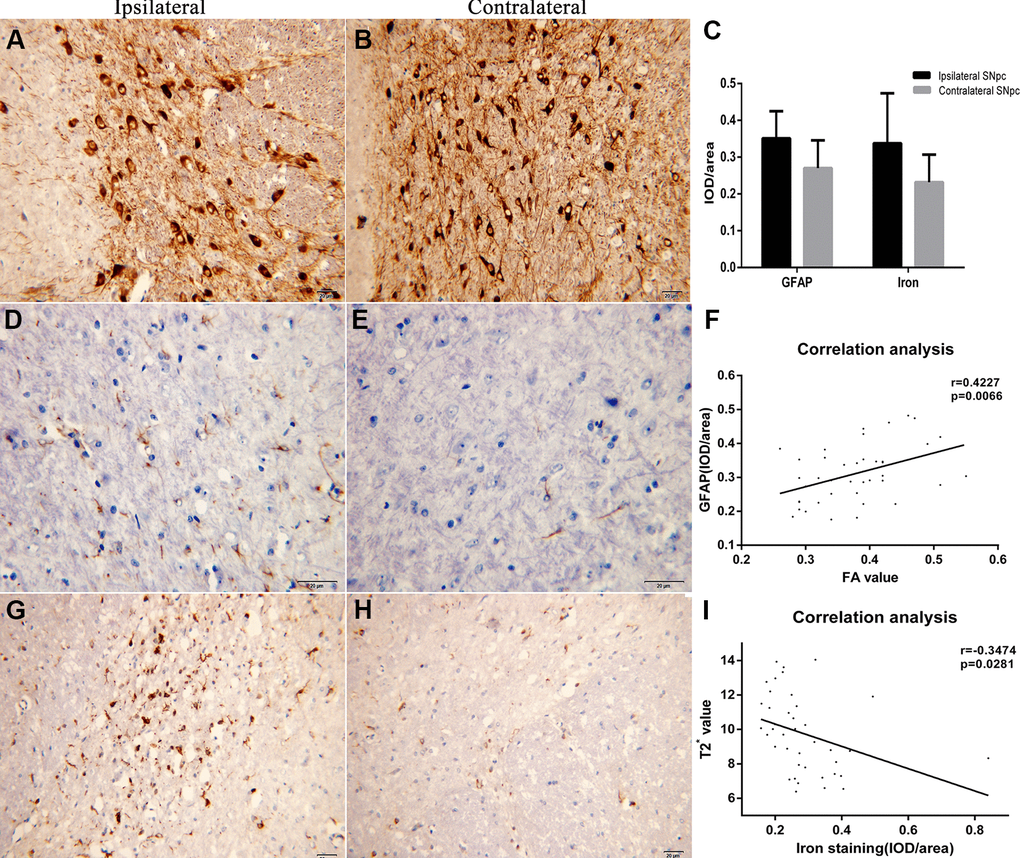
Figure 3.(A, B) The immunohistochemistry images of TH staining in ipsilateral and contralateral SNpc are displayed respectively. (C) It shows the comparison results of the IOD/area of GFAP and iron staining. (D, E) The immunohistochemistry images of GAFP staining in ipsilateral and contralateral SNpc are displayed respectively. (F) Correlation analysis between the FA values and IOD/area of GFAP. (G, H) The immunohistochemistry images of iron staining in ipsilateral and contralateral SNpc are displayed respectively. (I) Correlation analysis between the T2* values and IOD/area of iron staining.