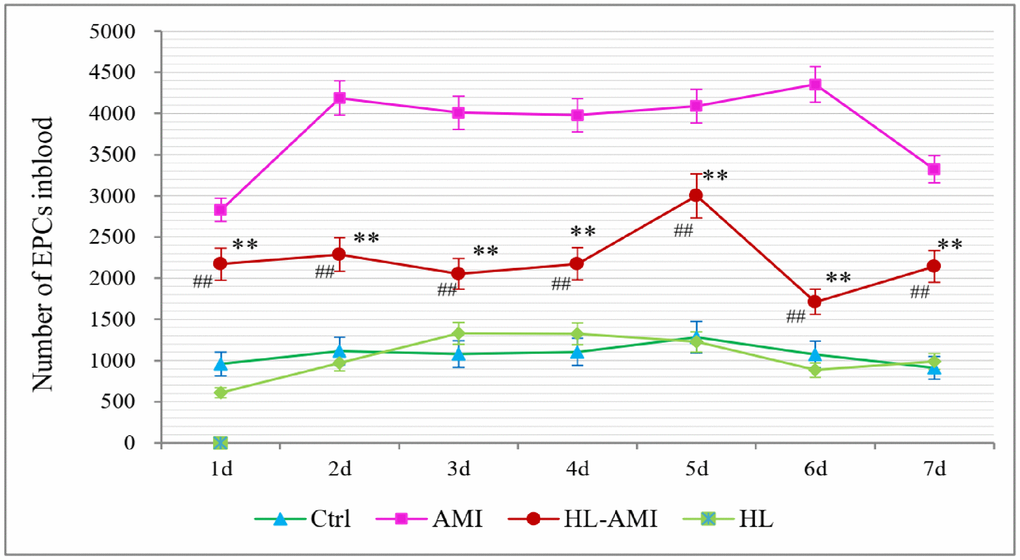
Figure 6.Change in the number of CEPCs in each group rats during 7 days after AMI. **, P < 0.01, compared with the AMI group; ##, P < 0.01, compared with the HL group. Each data point is the average of the group of eight rats, and vertical lines indicate the SEM.