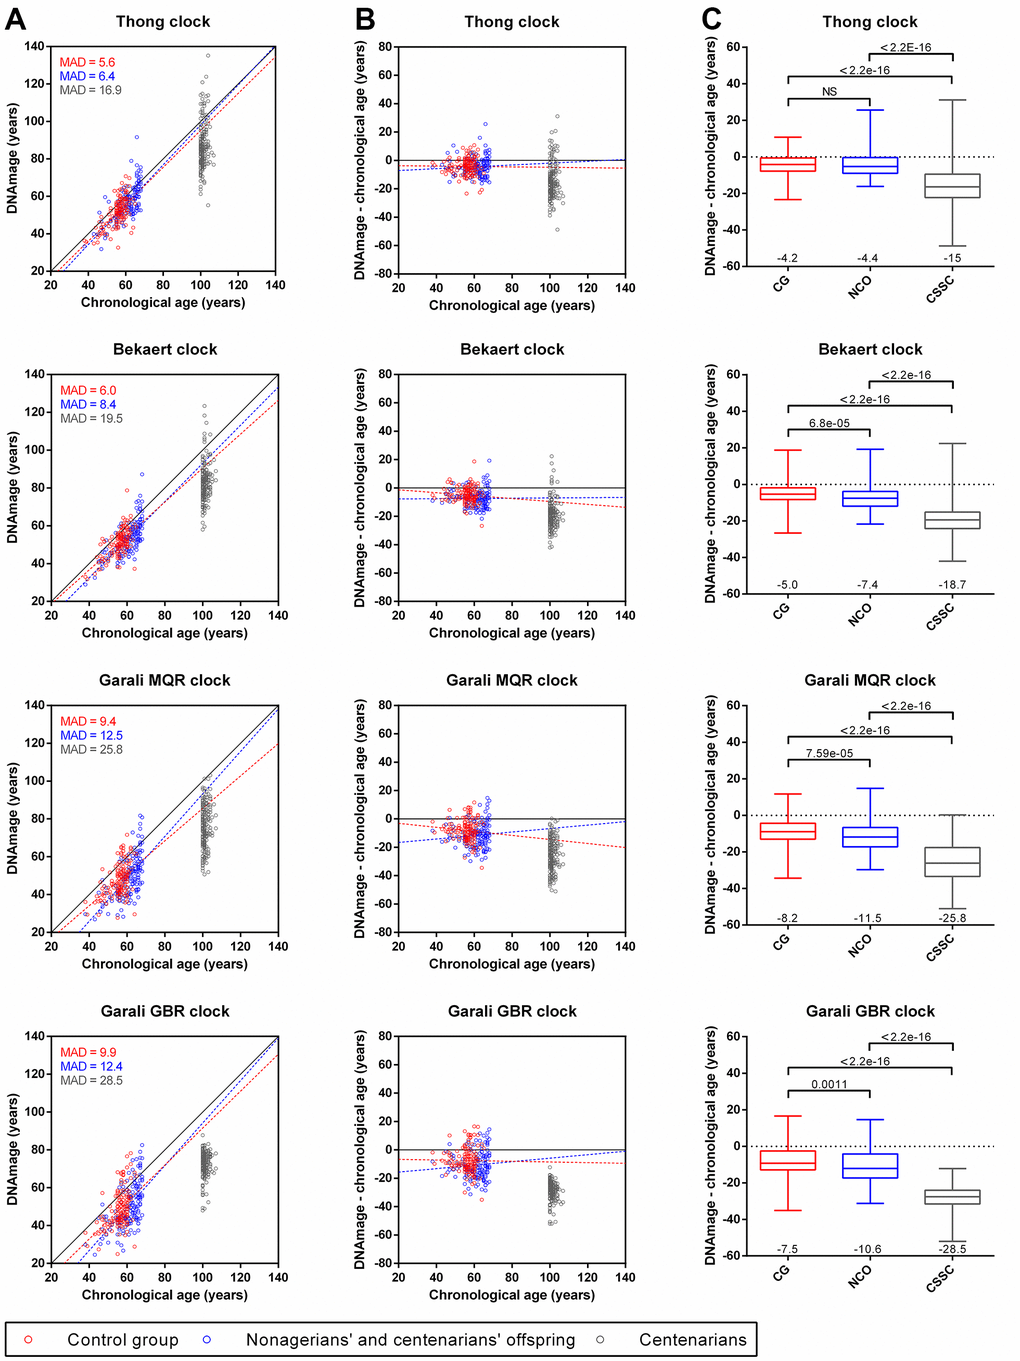
Figure 3.Comparison of DNAmage and chronological age obtained with the four epigenetic clocks for individuals from the control group (CG), nonagenarian’s and centenarians’ offspring (NCO) and centenarians (CSSC). (A) Scatterplots of the DNAmage and chronological age. The mean absolute deviation (MAD) of DNAmage from chronological age is given for each group. (B) Age differences between DNAmage and chronological age plotted against chronological age. Linear regression curves from CG and NCO samples are drawn in red and blue dotted lines (A, B), respectively. (C) Boxplots of DNAmage and chronological age differences according to each group. The mean age difference value is indicated at the bottom of each boxplot, while the p-values of the Mann-Whitney U tests are indicated at the top.