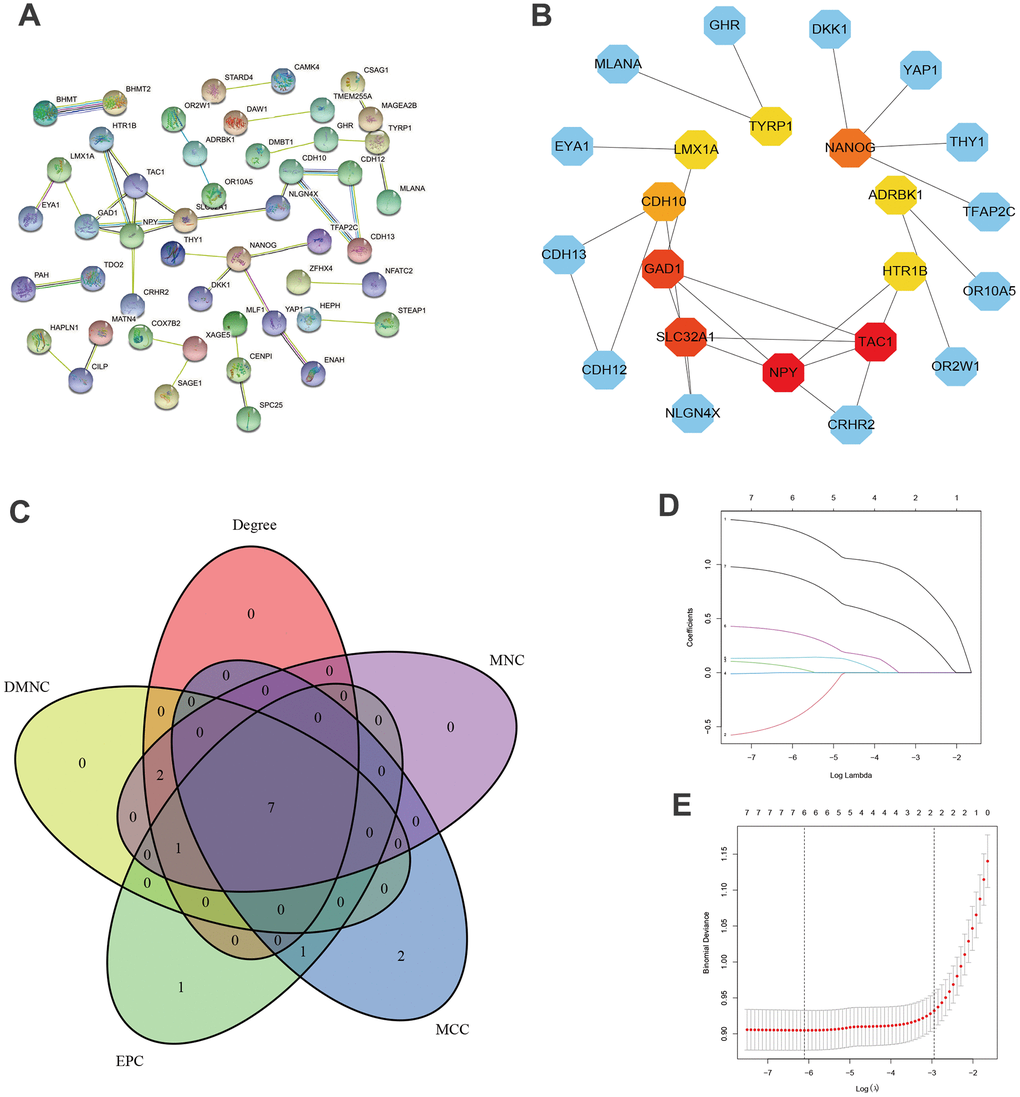
Figure 4.PPI networks. (A) PPI network of combined genes. (B) PPI network of top 10 Hub genes. (C) Venn diagrams of Hub genes based on MCC, MNC, Degree, DMNC, EPC methods. (D) Cross-validation for identifying parameters in LASSO. (E) LASSO regression of 6 hub genes.