Submit an Article
Navigate
Home
Editorial Board
Editorial Policies
Current Volume
Archive
Scientific Integrity
Publication Ethics Statements
Interviews with Outstanding Authors
Newsroom
Sponsored Conferences
Podcast
Contact
Special Collections
Submit an Article
Online ISSN: 1945-4589
Research Paper
|
Volume 14, Issue 22
|
pp. 9317–9337
High SURF4 expression is associated with poor prognosis of breast cancer
Back to article
Figure 8
(8 of 11)
−
100%
+
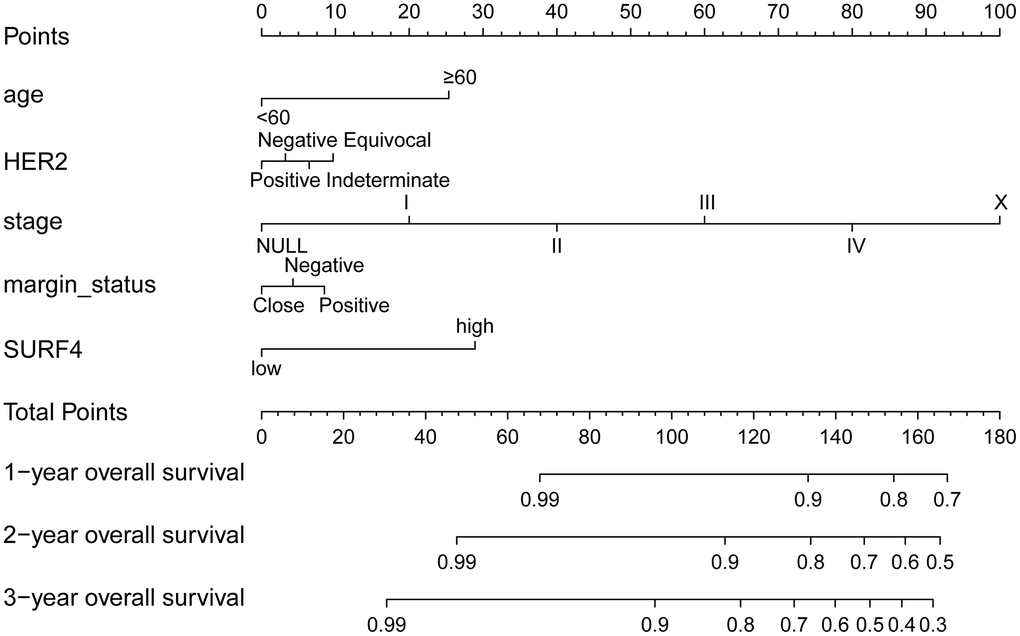
Figure 8.
The nomogram about SURF4 and OS.
1-, 3- and 5-year related survival probabilities were obtained by drawing a line straight down to the risk axis.
Figure 8 — High SURF4 expression is associated with poor prognosis of breast cancer | Aging