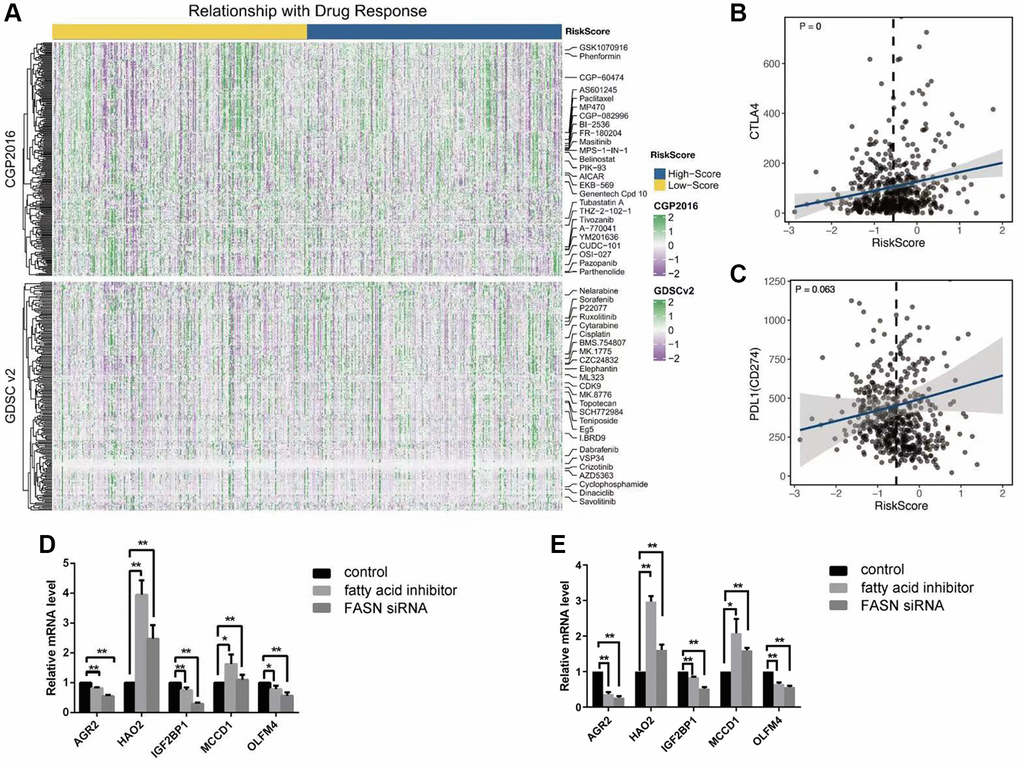
Figure 6.(A) The landscape of drug response by the CGP and GDSC; (B, C) The correlation between the risk score and the expression level of CTLA4 and PDL1; (D, E) The results of 5 key genes by the test of Q-PCR among three groups: control group; fatty acid inhibitor group, and the FASN siRNA group, caki-1 cell line (D); 786-0 cell line (E).