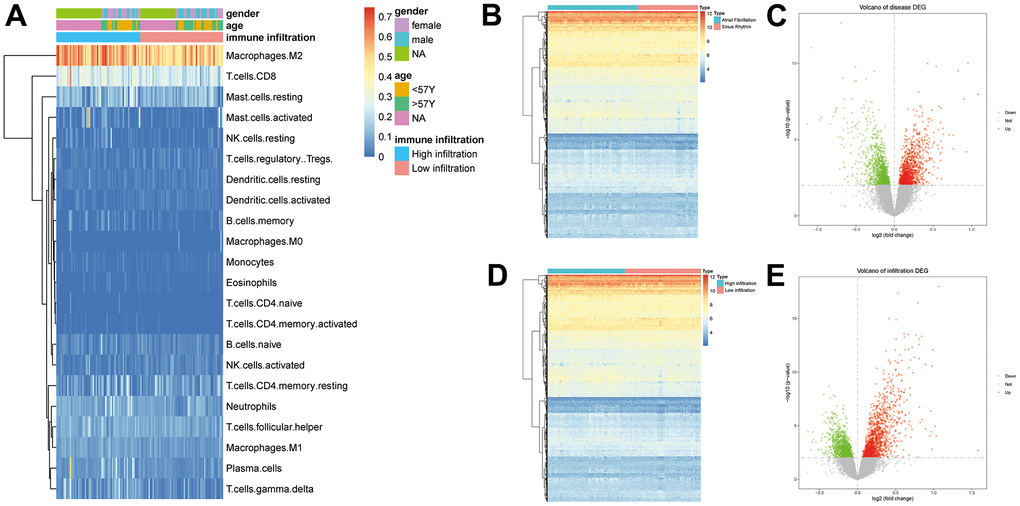
Figure 1.(A) Results of the immune infiltration analysis (p>0.05, *: p<0.05, **: p<0.01, ***: p<0.001, ****: p<0.0001). (B) Volcano plot of DEGs in AF and SR. (C) Heat map for the expression of the 2379 DEGs in AF. (D) Volcano plot of DEGs in immune infiltration. (E) Heat map for the expression of the 2607 DEGs in immune infiltration.