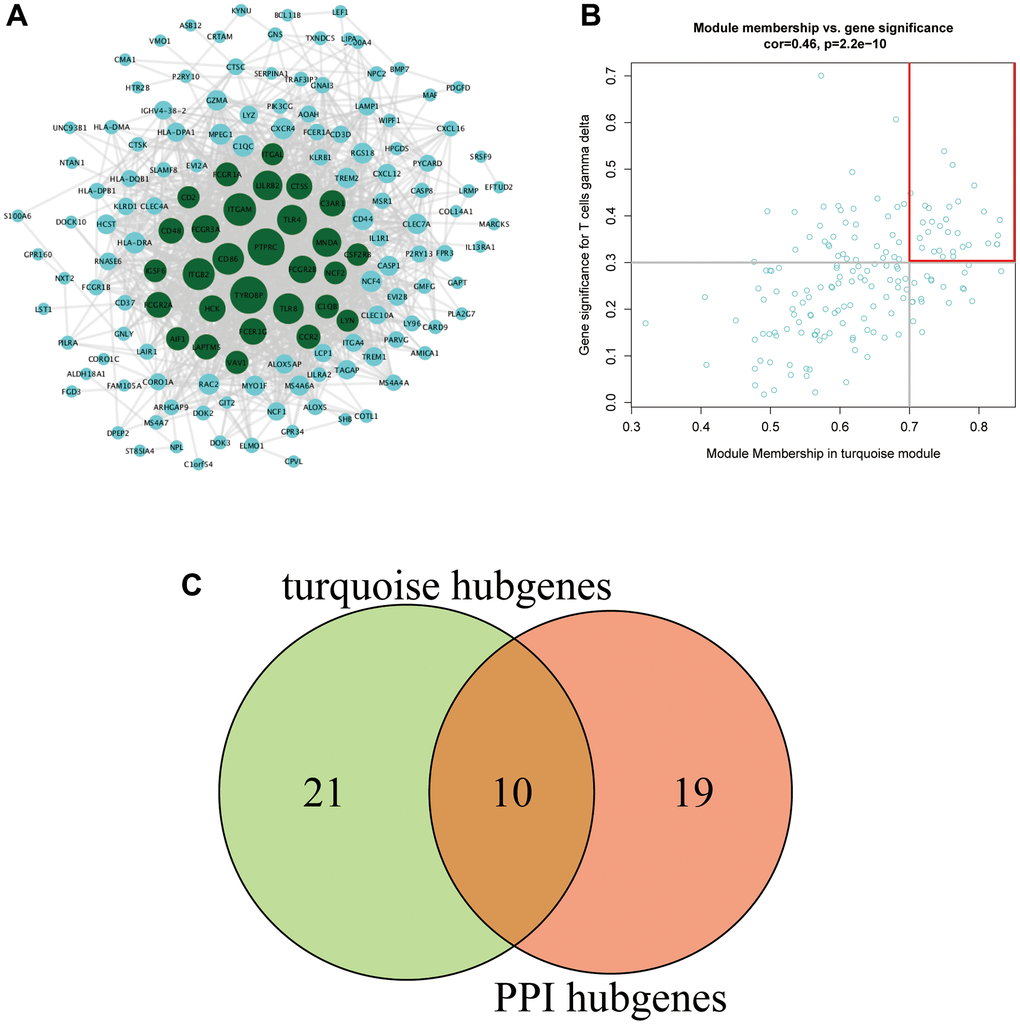
Figure 4.(A) PPI network of the turquoise module. The gene node size in the network reflects the degree of nodes, with a higher degree of gene connectivity corresponding to a larger font with which the gene is written. Green represents genes with a connectivity degree ≥30 (a total of 29 genes). (B) The key genes in the turquoise module. (C) Venn diagram of the key genes.