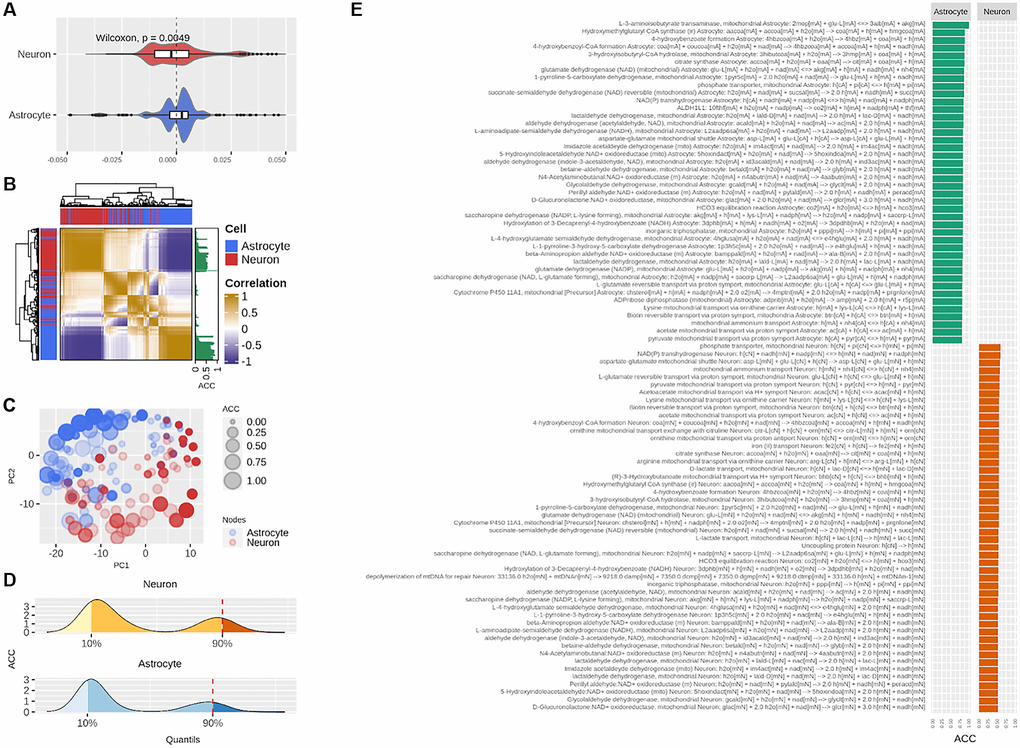
Figure 4.Centrality-based analysis of the neuron-astrocyte metabolic network further supports the division of labor between the neuron and astrocyte. (A) Distributions, separated by cell, of the contributions of each reaction to the centrality of the sensitivity set. (B) Unsupervised hierarchical clustering of the pairwise correlations between the contributions of each reaction to the centrality of the sensitivity set. The Absolute Centrality Contribution per reaction (ACC) is shown on the right-hand side of the heatmap. (C) Dimensionality reduction via Principal Component Analysis (PCA) of the pairwise correlations between the contributions of each reaction. (D) Distribution of ACC in the neuron (top) and astrocyte (bottom), here, the red dashed line by the 90% percentile indicates the cutoff over which reactions were considered central metabolic reactions. (E) ACC values for the central metabolic reaction separated by cell.