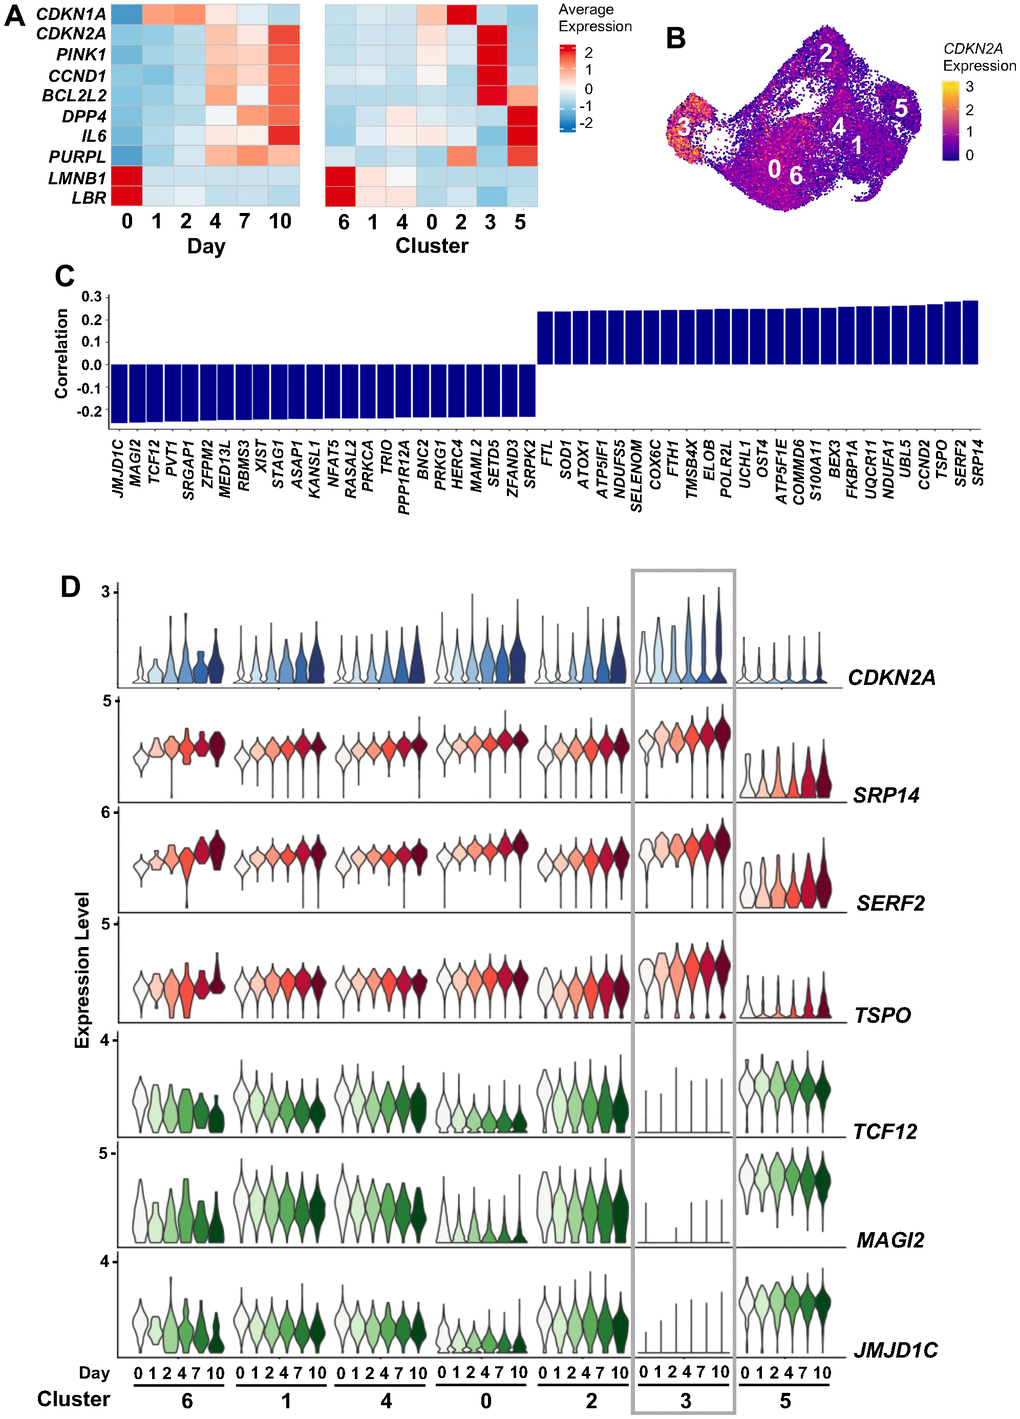
Figure 5.CDKN2A mRNA expression during ETO treatment. (A) Heatmaps showing changes in the expression levels of select senescence-associated transcripts across 10 days of ETO exposure (left), and the contribution of each cell cluster to these changes (right). (B) Feature plot showing increased CDKN2A mRNA expression in cluster 3. (C) Top RNAs correlated with CDKN2A mRNA expression levels by Pearson correlation coefficient; significance was calculated using paired student’s t-test, p < 0.01. (D) Expression of CDKN2A mRNA and its top three positively and negatively correlating RNAs from (C). Changes in RNA levels in each cluster and time point are indicated.