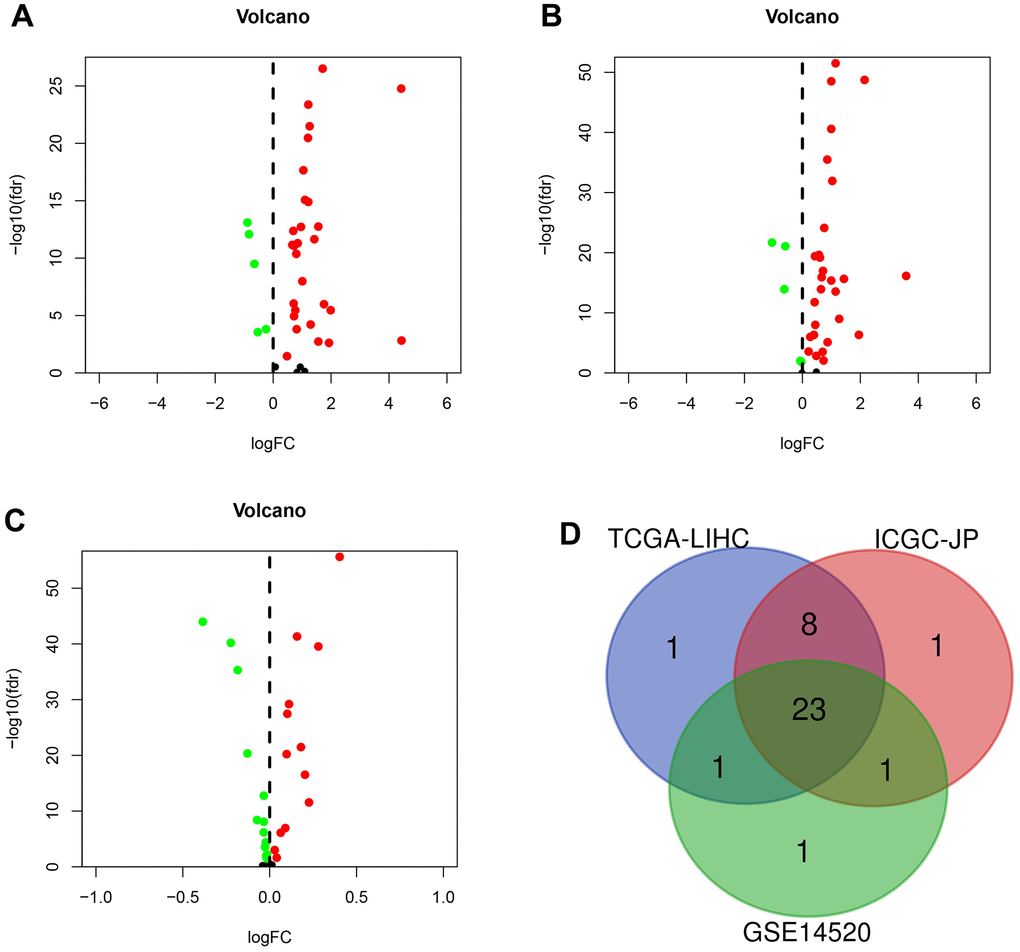
Figure 1.The differentially expressed genes (DEGs) were screened in different sets. (A) DEGs (n = 33) in TCGA-LIHC set. (B) DEGs (n = 33) in the ICGC-JP set. (C) DEGs (n = 26) in GEO-GSE14520 set. (D) Venn diagram for the overlapping genes.
Figure 1 — Profiling and integrated analysis of transcriptional addiction gene expression and prognostic value in hepatocellular carcinoma | Aging