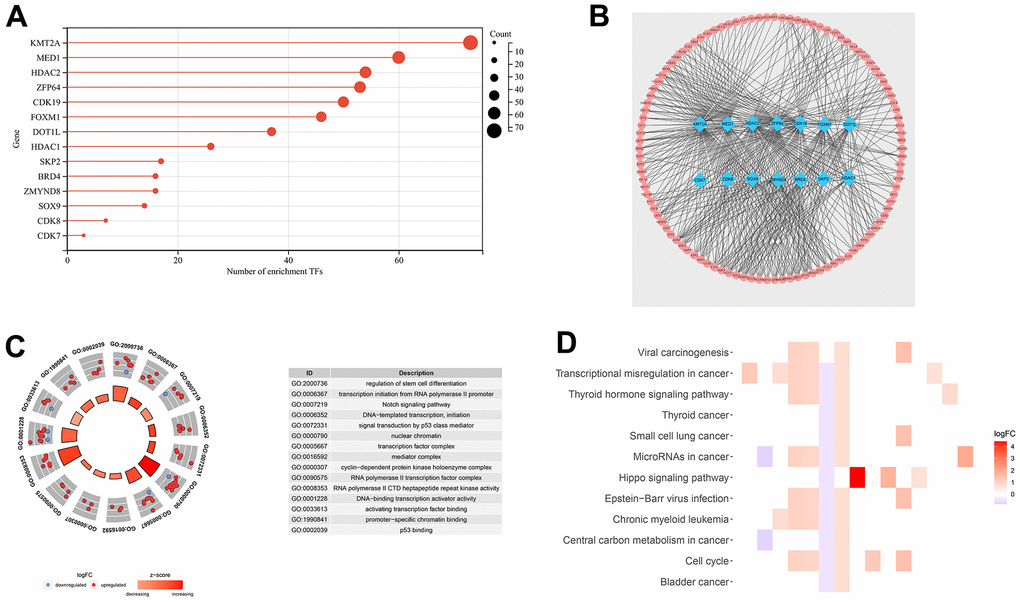
Figure 2.Transcription factor co-expression network and gene function analysis for TCGA-LIHC set. (A) The bar chart shows the number of transcription factors related to DEGs. (B) Co-expression network of 14 DEGs and 314 transcription factors. (C) Functional annotation for transcriptional addiction genes using GO term enrichment analysis, according to the top five biological processes, the top five cellular components, and the top five molecular functions. (D) The top 15 KEGG enrichment pathways of transcriptional addiction genes.