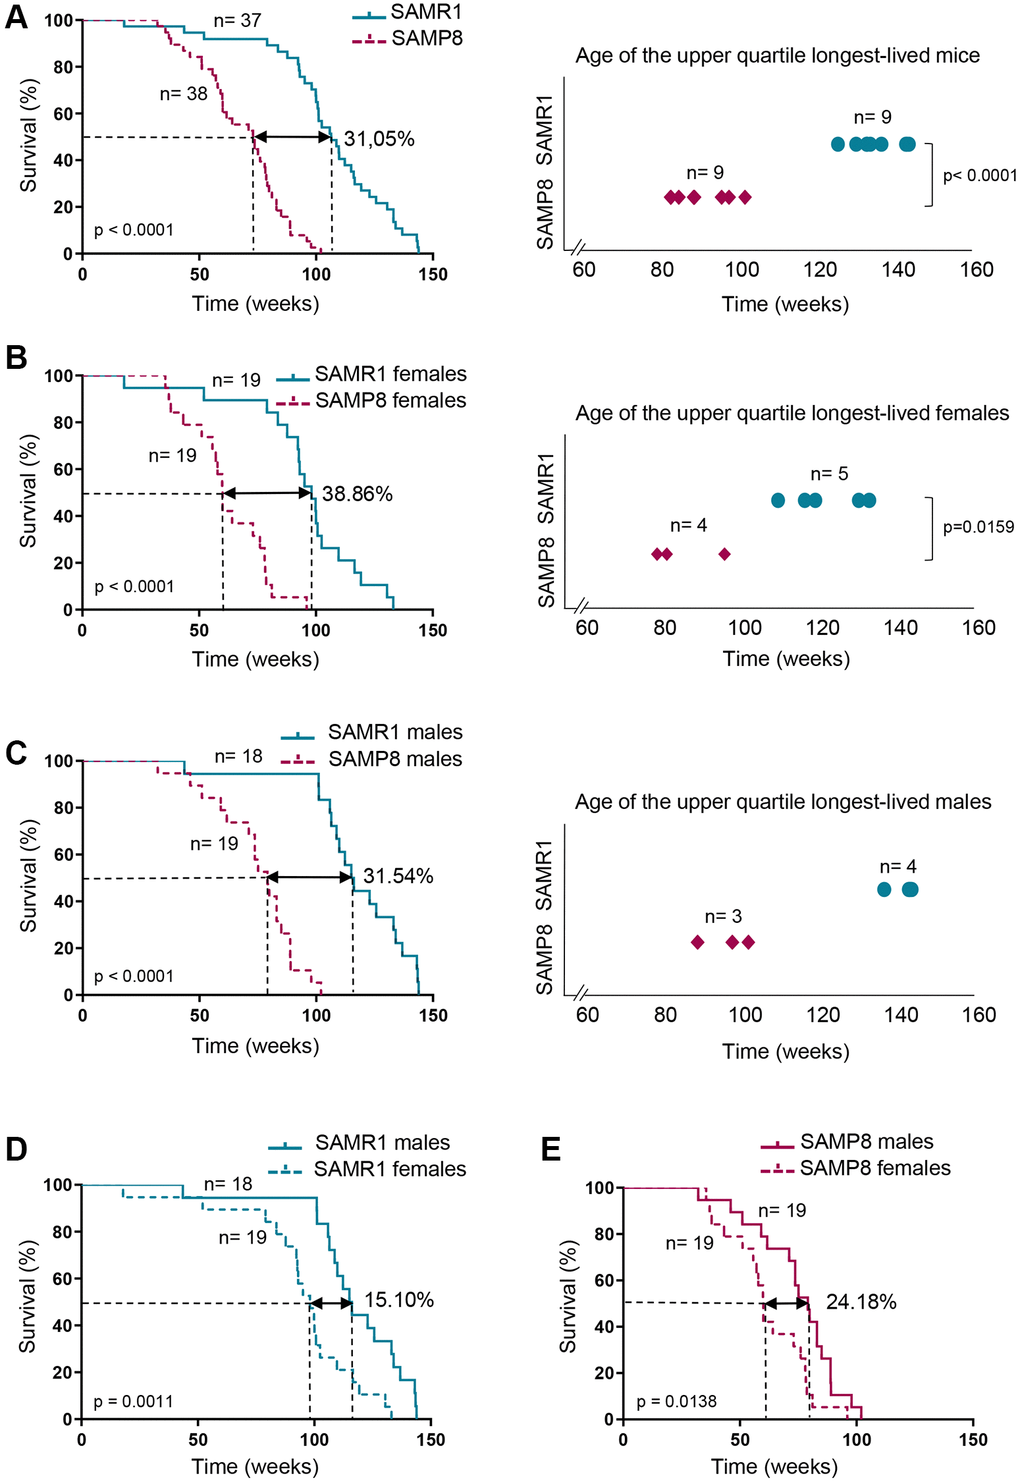
Figure 1.Analysis of SAMP8 and SAMR1 lifespan. (A) Kaplan-Meier plot of survival of SAMP8 (purple lines) and SAMR1 (turquoise lines) in the left panel, and graphic representation of the time of death of the Q3 longest-lived SAMP8 (purple rhombus) and SAMR1 (turquoise dots) mice in the right panel. (B) Kaplan-Meier plot of survival (left panel) and graphic representation of the time of death of the Q3 longest-lived females (right panel) of the mouse models described in A. (C) Kaplan-Meier plot of survival (left panel) and graphic representation of the time of death of the Q3 longest-lived males (right panel) of the mouse models described in A. (D) Kaplan-Meier plot of survival of SAMR1 mice breakdown by sex (females in dashed line and males in continued line). (E) Kaplan-Meier plot of survival of SAMP8 mice breakdown by sex (females in dashed line and males in continued line). n indicates the number of mice analyzed. Long-rank test was used to calculate p-values comparing lifespan distributions (A, B and C, left panels; D and E). t-test was used to determine p-value when comparing maximum lifespan of the upper quartile longest-lived mice (A, right panel). Mann-Whitney U test was used to determine p-value in maximum lifespan of the upper quartile longest-lived mice (B and C, right panels).