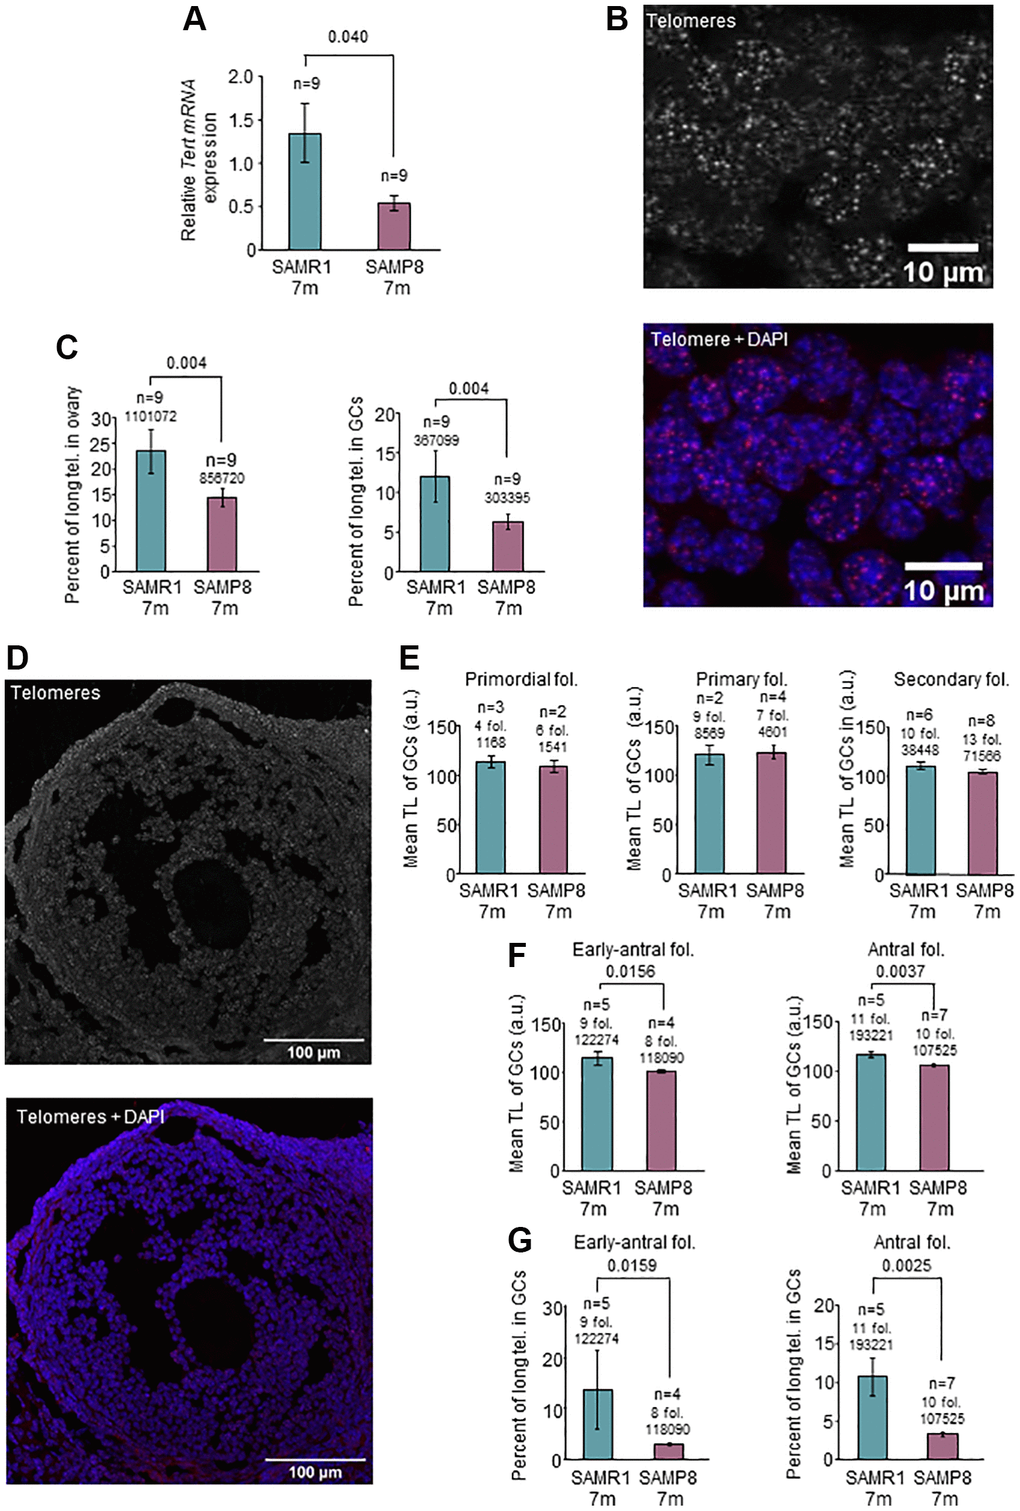
Figure 3.Analysis of Tert expression and telomere length in the ovary. (A) The graph shows mean mRNA expression of Tert normalized by Gapdh in the ovary of 7-month-old SAMP8 and SAMR1 females, measured by RT-qPCR. (B) The micrographs show representative images of telomere FISH on ovarian sections (white dots, left panel) and the merge (DAPI in blue and telomeres in red, right panel). (C) Percent of long telomeres in the ovary (left panel) and in GCs (right panel) in 7-month-old SAMP8 and SAMR1 females. (D) The micrographs show representative images of an antral follicle after telomere FISH (white dots, top panel) and the merge (DAPI in blue and telomeres in red, lower panel). (E) Mean TL, analyzed by FISH, of GCs of primordial, primary and secondary follicles in 7-month-old SAMP8 and SAMR1 females. (F) Mean TL, analyzed by FISH, of GCs of early-antral (left panel) and antral (right panel) follicles in 7-month-old SAMP8 and SAMR1 females. (G) Percent of long telomeres in GCs of early-antral (left panel) and antral follicles (right panel) in 7-month-old SAMP8 and SAMR1 females. n indicates the number of mice analyzed. Underneath the n or the number of follicles, the number of telomere spots is indicated. The S.E.M. is represented in error bars (A, C, E, F and G). Statistical significance was determined by unpaired t-test (E and F, right panels) and Mann-Whitney U test, for the rest of graphs. Scale bars are 10 μm (B) and 100 μm (D).