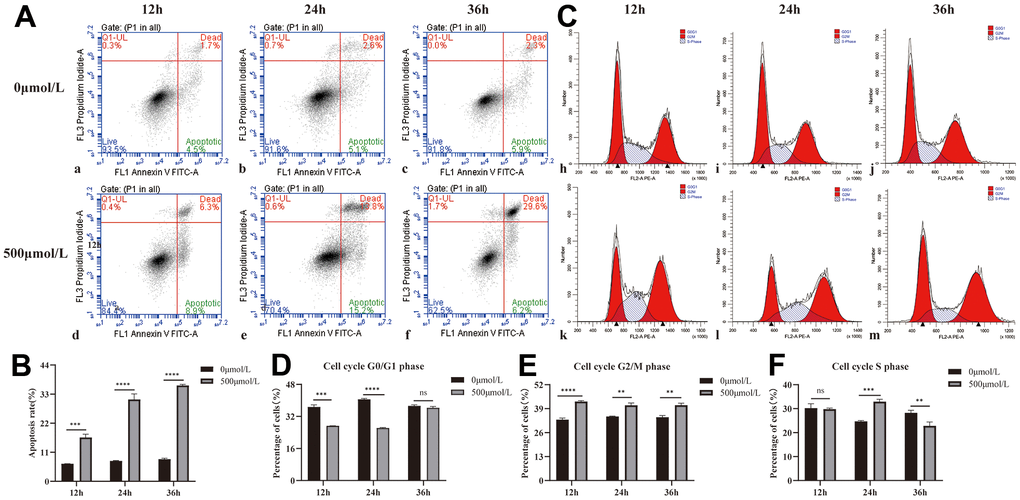
Figure 1.Effect of H2O2 on apoptosis and cycle of HLEB3. (A) a, b, and c are the 0μmol/L H2O2 group apoptotic diagrams at 12, 24, and 36 hours, and d, e, and f are the 500μmol/L H2O2 group apoptotic diagrams at 12, 24, and 36 h, respectively. (B) The statistical result of apoptosis in each group. (C) h, i and j are the 12, 24 and 36h cycle diagrams of the 0μmol/L H2O2 group, and k, l and m are the 12, 24 and 36 h cycle diagrams of the 500μmol/L H2O2 group, respectively. (D–F) The statistical results of each period. ns p>0.05, **p<0.01, ***p<0.001, ****p<0.0001.