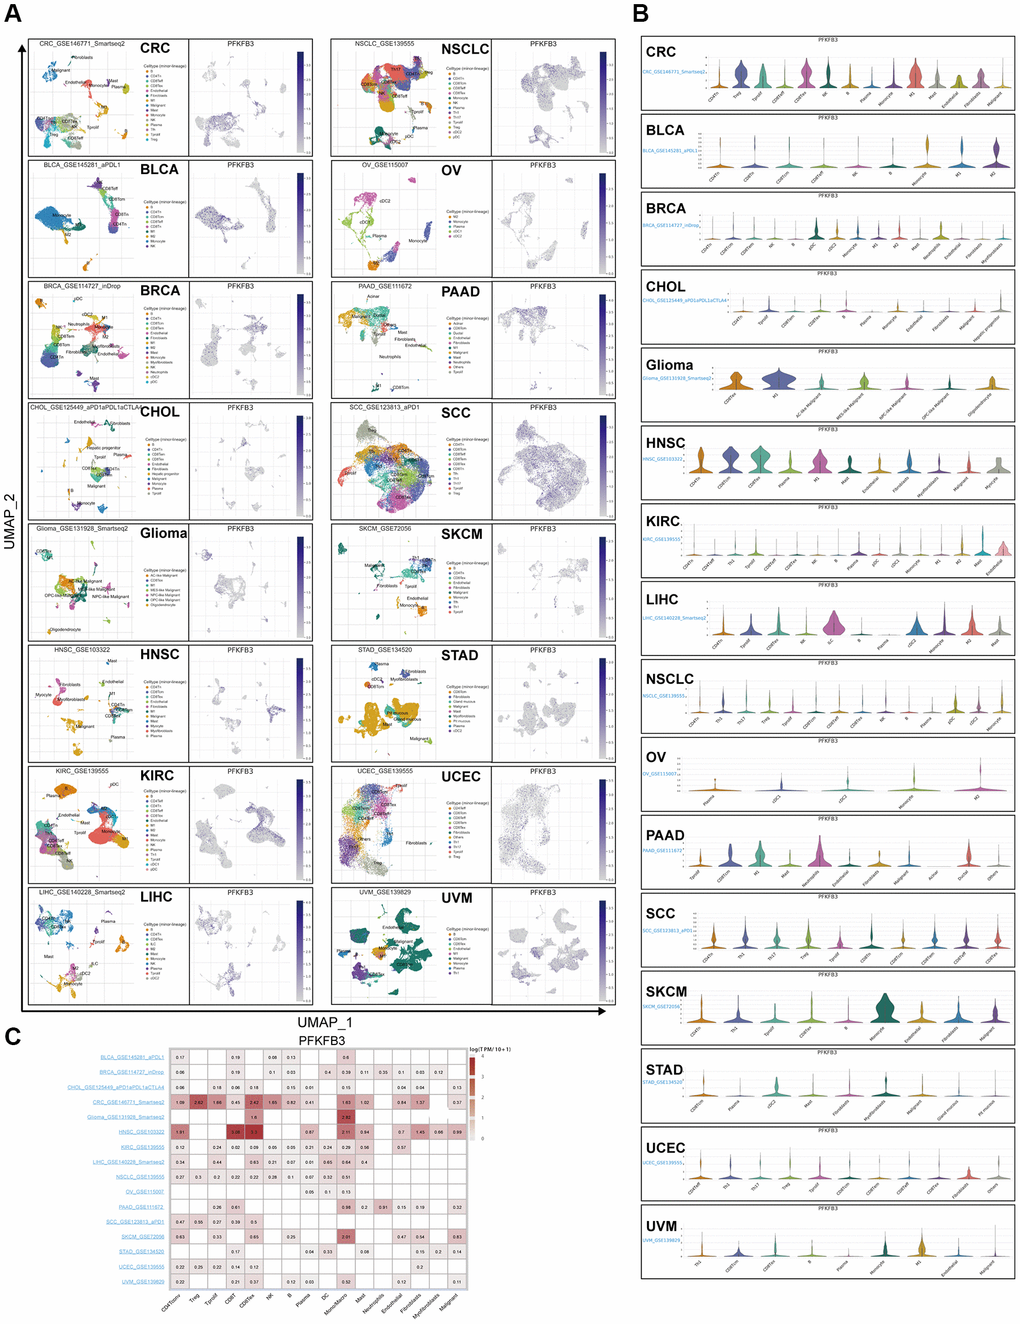
Figure 6.Single-cell analyze the characteristic of the PFKFB3 expression in pan-cancer. (A) The visualized single-cell UMAP plots are to show the cell distribution of treatment response groups (left) and the expression of PFKFB3 (right). (B) The grid violin plot reflects the distribution of PFKFB3 expression in different cell types across all datasets with various cancers. (C) The heatmap reflects the distribution of PFKFB3 expression in different cell types across all datasets with various cancers.