


Introduction
Glycolysis is an essential enzymatic process in cell metabolism. The substrates produced from glycolysis are required in many metabolic pathways, such as the tricarboxylic acid cycle, pentose phosphate pathway, and nucleotide, amino acid, and lipid synthesis pathways. Cancer cell metabolism is commonly reprogrammed to the glycolytic pathway to address the need for increased glucose uptake and production of lactate. This metabolic switch occurs even when the tumor cells have mitochondria and are in sufficient oxygen conditions for normal oxidative phosphorylation, suggesting that glycolysis plays an important role in tumorigenesis [1–4].
The 6-phosphofructo-2-kinase/fructose-2,6-bisphosphatase (PFK-2/FBPase-2, PFKFB) protein is a major regulator of glycolysis and functions as a bifunctional enzyme that reversibly regulates fructose 2,6-bisphosphate synthesis and degradation [5]. Four isozymes of PFK-2 have been identified: PFKFB1, PFKFB2, PFKFB3, and PFKFB4. PFKFB3 is widely involved in multiple biological processes, such as angiogenesis, DNA damage repair, autophagy, cell cycle, and response to hypoxia [6–9]. The tumor microenvironment (TME) is a key regulatory factor in tumors and contributes to the initiation, progression, and metastasis of tumors [10]. Some studies have demonstrated the aberrant expression of PFKFB3 in cancer tissues and its role in tumorigenesis [11]. However, the systematic study of crosstalk between PFKFB3 and TME in pan-cancer has less been examined.
In this study, we conducted a comprehensive assessment of the relationship between PFKFB3 expression, patient prognosis, and especially TME in cancers based on the TCGA database. To study the role of PFKFB3 in tumors, we studied the mRNA and protein expression level, phosphorylation modification, genetic alteration, Tumour mutational burden (TMB), Microsatellite instability (MSI), DNA mismatch repair (MMR), immune infiltration, clinical outcome, the characteristic of expression in a single cell, and function of enrichment of PFKFB3 were used to investigate the potential roles in tumor development.
Results
The characteristic of PFKFB3 expression in pan-cancer
We first analyzed the mRNA expression level of PFK-2 family genes across various cancer types in TCGA and GTEx datasets using the GEPIA database. Compared with other PFK-2 family members, the mRNA expression level of PFKFB3 was much higher than PFKFB1, PFKFB2, and PFKFB4 (Supplementary Figure 1). The mRNA expression level of PFKFB3 was markedly elevated in tumor tissues of colon adenocarcinoma (COAD), cholangiocarcinoma (CHOL), head and neck squamous cell carcinoma (HNSC), stomach adenocarcinoma (STAD), and thyroid carcinoma (THCA) compared with the respective non-tumor tissues (Figure 1A). However, PFKFB3 mRNA level was lower in tumor tissues of breast invasive carcinoma (BRCA), bladder urothelial carcinoma (BLCA), kidney renal clear cell carcinoma (KIRC), kidney chromophobe (KICH), kidney renal papillary cell carcinoma (KIRP), liver hepatocellular carcinoma (LIHC), lung squamous cell carcinoma (LUSC), lung adenocarcinoma (LUAD), prostate adenocarcinoma (PRAD), lymphoid neoplasm diffuse large B-cell lymphoma (DLBC), and thymoma (THYM) compared with corresponding non-tumor tissues (Figure 1A and Supplementary Figure 2). Furthermore, strong correlations between PFKFB3 expression and pathological stage were observed in endocervical adenocarcinoma (CESC), THCA, pancreatic adenocarcinoma (PAAD), testicular germ cell tumors (TGCT), and Ovarian serous cystadenocarcinoma (OV, all P < 0.05, Figure 1B and Supplementary Figure 3).
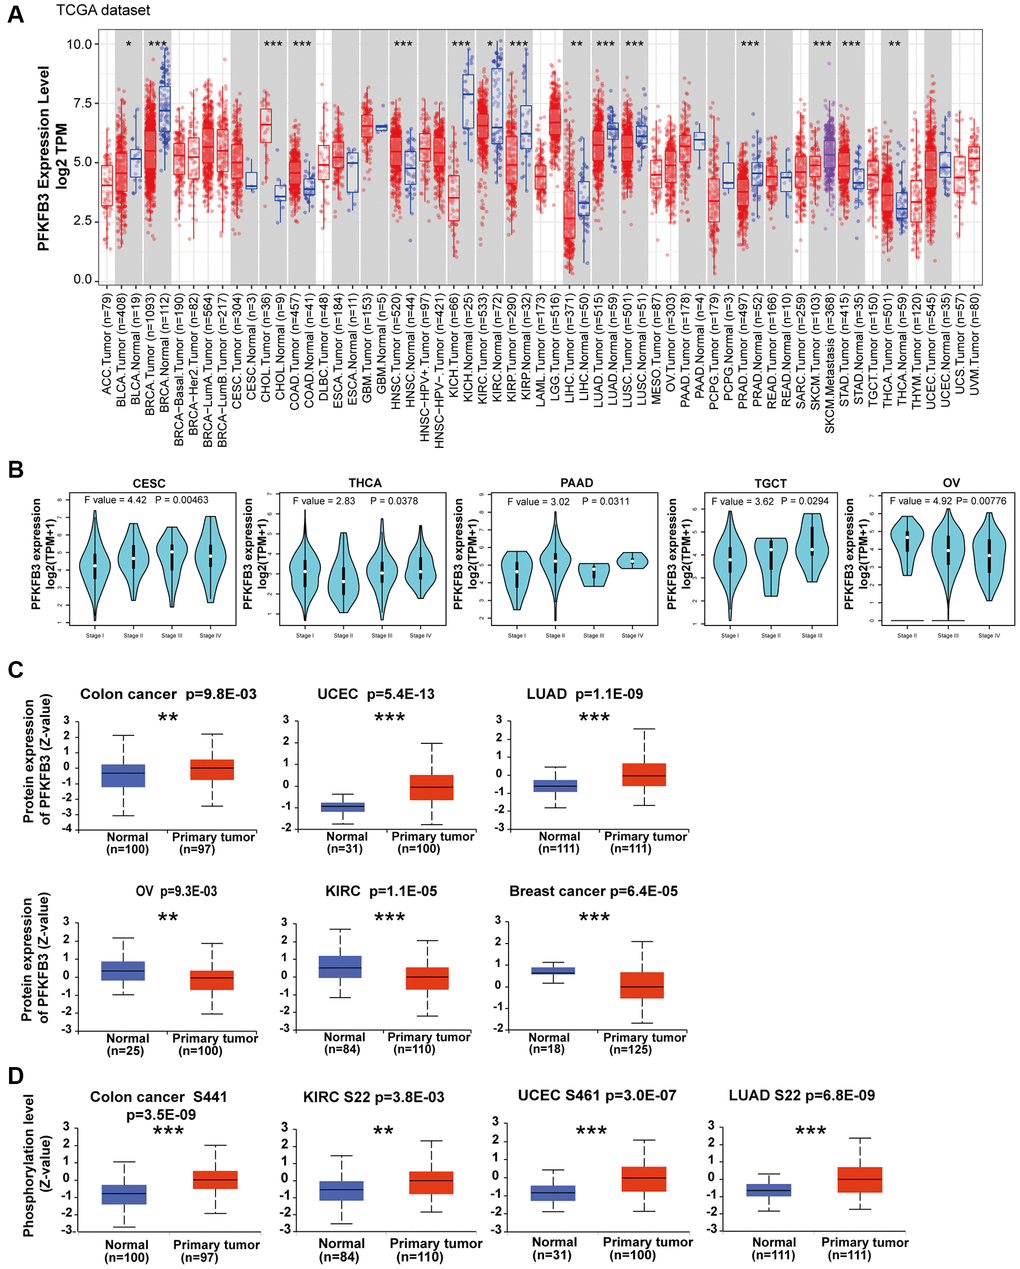
Figure 1. Expression level and phosphorylation of PFKFB3 in pan-cancer. (A) The expression status of the PFKFB3 gene in different cancers was analyzed via TIMER2. *P < 0.05; **P < 0.01; ***P < 0.001. (B) The expression of the PFKFB3 gene was studied according to the pathological stage (stage I–IV) of the different TCGA cancers, including CESC, THCA, PAAD, TGCT, and OV. (C) We analyzed the expression level of PFKFB3 protein in tumor and non-tumor tissues of colon cancer, UCEC, LUAD, ovarian cancer, KIRC, and breast cancer by the CPTAC dataset. **P < 0.01, ***P < 0.001. (D) We analyzed the phosphorylation level of PFKFB3 (S22, S461, and S441 sites) between primary tumor tissue and non-tumor tissues via the UALCAN. **P < 0.01, ***P < 0.001.
PFKFB3 protein level was analyzed by the CPTAC dataset, and the results showed that the protein level of PFKFB3 in colon cancer (p = 9.8E-03), uterine corpus endometrial carcinoma (UCEC, p = 5.4E-13), and LUAD (p = 1.1E-09) was much higher than in non-tumor tissues, while lower expression of PFKFB3 was observed in OV (p = 9.3E-03), KIRC (p = 1.1E-05), and breast cancer (p = 6.4E-05, Figure 1C).
We have used the UALCAN database to investigate the promoter methylation level of PFKFB3 in human pan-cancer. We found the promoter methylation level of PFKFB3 was significantly decreased in TGCT, UCEC, BLCA, LUSC, PRAD, HNSC, THCA, LIHC, and LUAD tissues compared to normal tissues according to the UALCAN database (Supplementary Figure 4A). The methylation level of PFKFB3 in KIRC, BRCA, COAD, SARC, and KIRP was greatly increased compared to normal tissues (Supplementary Figure 4B).
Combining UALCAN with the CPTAC dataset, we analyzed PFKFB3 phosphorylation levels in five types of tumors (breast cancer, colon cancer, KIRC, LUAD, and UCEC). Phosphorylation of S22 on PFKFB3 was significantly elevated in KIRC (P < 0.01) and LUAD (P < 0.001) (Figure 1D). Higher phosphorylation at S461 was observed in UCEC (P < 0.001), but not in breast cancer. Followed by a significantly increased phosphorylation level of the S441 was found in colon cancer (P < 0.001, Figure 1D).
The survival prognosis value of PFKFB3 in pan-cancer
We explored the survival prognosis value of PFKFB3 using Kaplan-Meier, the overall survival (OS) results show that high expression of PFKFB3 was significantly correlated to the poor OS for patients with adrenocortical carcinoma (ACC) (HR = 2.91, logrank p = 0.0087), KIRP (HR = 2.14, logrank p = 0.0168), STAD (HR = 1.47, logrank p = 0.0239), and LIHC (HR = 1.52, logrank p = 0.0179, Figure 2A), and the similar results were shown in Figure 2C. Progression-free survival (PFS) analysis showed high PFKFB3 expression was significantly correlated with poor prognosis for TCGA cases of ACC (HR = 3.13, logrank p = 0.0006), COAD (HR = 1.72, logrank p = 0.0035), KIRP (HR = 1.68, logrank p = 0.0550), sarcoma (SARC, HR = 1.58, logrank p = 0.0077), and uveal melanoma (UVM, HR = 3.63, logrank p = 0.0035, Figure 2B), and disease-free survival (DFS) analysis showed similar results in Figure 2D. Moreover, low expression of the PFKFB3 gene was significantly correlated with poor prognosis for KIRC (Figure 2).
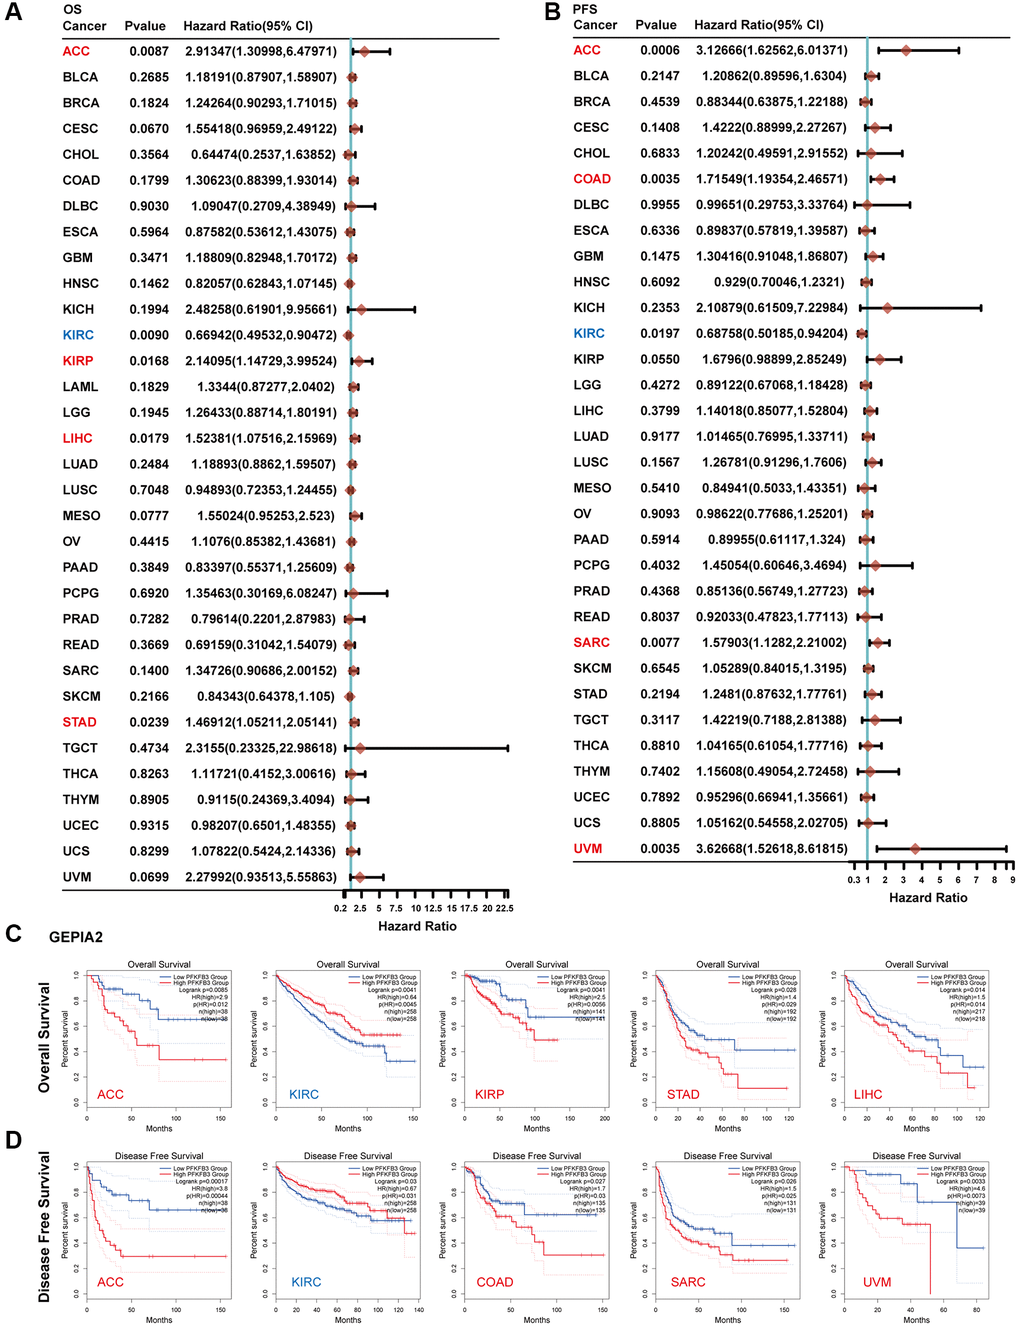
Figure 2. The correlation between PFKFB3 gene expression and survival prognosis in pan-cancer. (A) Analyzing overall survival (OS) of various tumors in TCGA according to PFKFB3 gene expression. (B) Analyzing Progression-free survival (PFS) of various tumors in TCGA according to PFKFB3 gene expression. (C) We utilized the GEPIA2 to analyze OS of various tumors in TCGA according to PFKFB3 gene expression. (D) We utilized the GEPIA2 to analyze disease-free survival (DFS) of various tumors in TCGA according to PFKFB3 gene expression.
The characteristic of PFKFB3 mutation and the relationship between PFKFB3 expression and TMB, MSI, and MMRs in pan-cancer
We investigated the genomic alteration and genetic modification of PFKFB3 in TCGA pan-cancer using the cBioPortal. The alteration frequency of PFKFB3 was highest in BLCA tumors (<9%) and the second highest alteration frequency was observed in OV tumors (<6%), and their main type was “amplification” (Figure 3A). The type, site, and case numbers of PFKFB3 genetic change and genetic modification were shown in Figure 3B. Furthermore, we have utilized TIMER 2.0 to analyze the correlation between mutated PFKFB3 and immune infiltration in pan-cancer. The results showed that mutated PFKFB3 was positively correlated with B cells and CD8+ T cells immune infiltration in UCEC (Supplementary Figure 5A), and positively correlated with macrophage immune infiltration in STAD (Supplementary Figure 5B). The mutated PFKFB3 was negatively correlated with macrophage immune infiltration in LUSC (Supplementary Figure 5C).
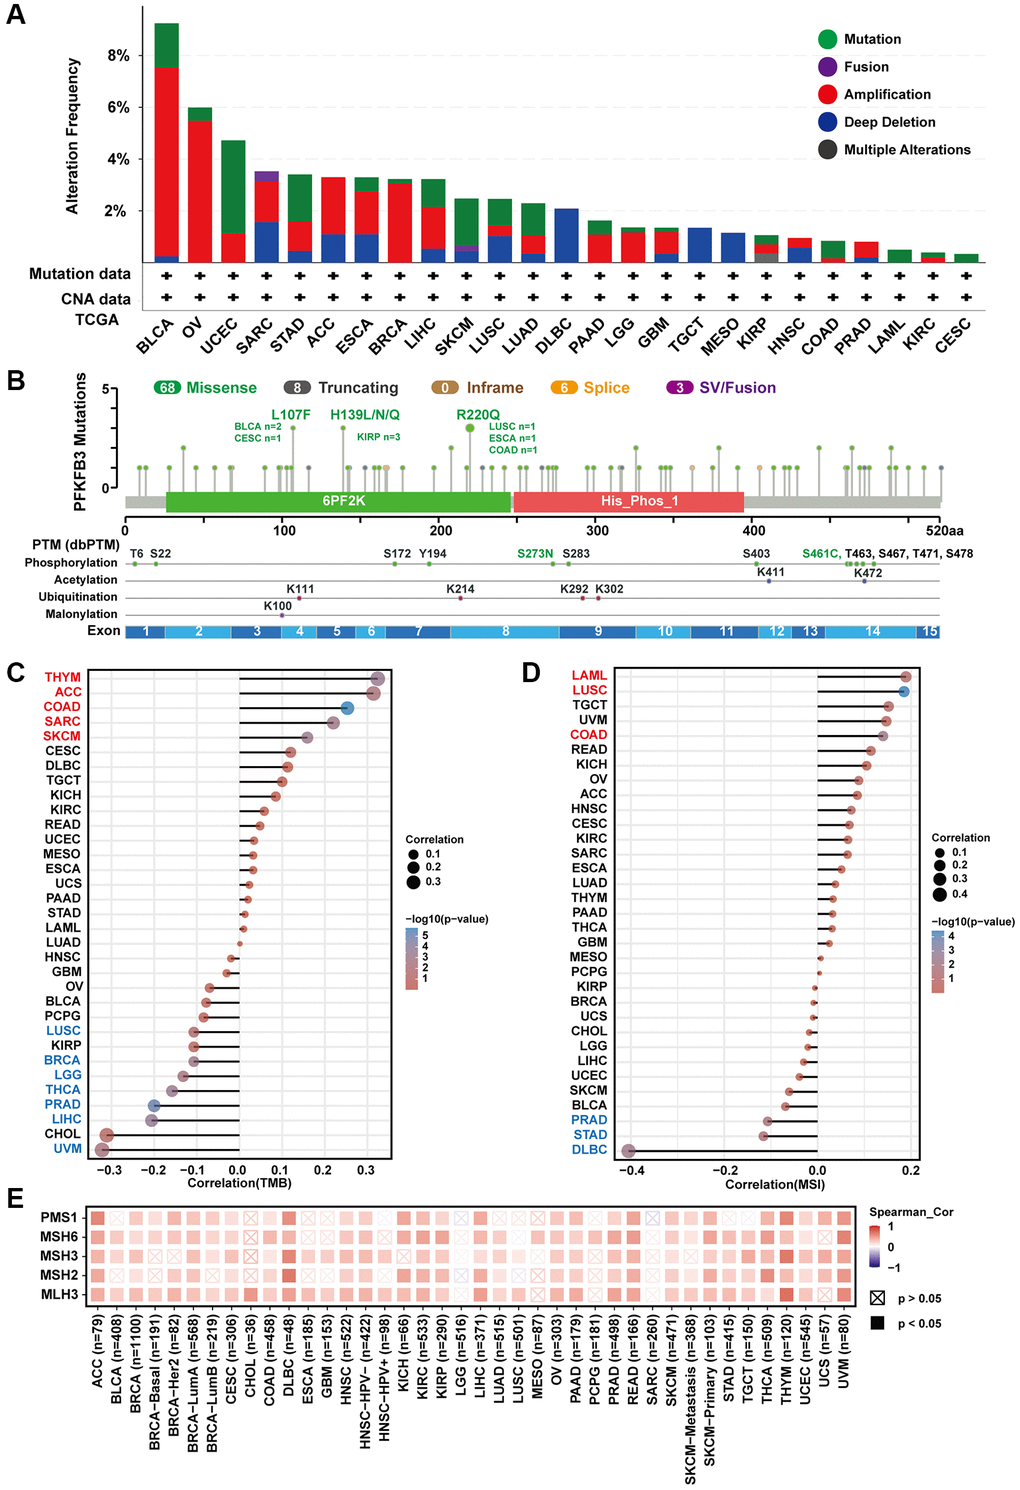
Figure 3. The characteristic of PFKFB3 mutation and the relationship between TMB, MSI, and MMRs in pan-cancer. (A) We utilized the cBioPortal tool to study the genomic alteration of PFKFB3 for different tumors. (B) The characteristic of PFKFB3 mutations and posttranscriptional modification. (C) The relationship between PFKFB3 expression and TMB in various malignancies. (D) The association between PFKFB3 expression and MSI in pan-cancer. In Figure 3C and 3D, red fonts indicate a positive correlation and blue fonts indicate a negative correlation. (E) Correlation between PFKFB3 expression and MMRs.
TMB is a biomarker for immunotherapy, which could predict immune checkpoint inhibitors’ efficacy in numerous cancer types [12]. Our results show that PFKFB3 expression was correlated positively with TMB in THYM, ACC, COAD, SARC, and skin cutaneous melanoma (SKCM); and correlated negatively with TMB in LUSC, BRCA, brain lower grade glioma (LGG), THCA, PRAD, LIHC, and UVM (Figure 3C). Furthermore, MSI acts as a predictor of response to immunotherapy and chemotherapy and is directly linked to tumor development [13]. Further analysis of PFKFB3 expression indicated positive correlations with MSI in acute myeloid leukemia (LAML), LUSC, and COAD; and negative correlations with MSI in PRAD, STAD, and DLBC (Figure 3D).
MMR could maintain genome stability against spontaneous DNA damage [13]. MSI is caused by deficiencies in MMR. Furthermore, we study the correlation between PFKFB3 expression and MMR. The results show that PFKFB3 expression was positively correlated with five MMR genes, including PMS1 homolog 1, mismatch repair system component (PMS1), mutS homolog 6 (MSH6), mutS homolog 3 (MSH3), mutS homolog 2 (MSH2), and mutL homolog 3 (MLH3) (Figure 3E).
The correlation between PFKFB3 gene expression and immune infiltration in cancer
TME is directly associated with treatment response and clinical prognosis of tumors [10]. Immune infiltration cells are regarded as one of the dominant elements of TME [14]. To explore immune cell infiltration of PFKFB3 in cancers, we analyzed the correlation between the immune cell infiltration and PFKFB3 expression in TCGA pan-cancer. Combining CIBERSORT and TIMER analysis, we found a significant positive association between PFKFB3 expression level and neutrophil, macrophage, and myeloid dendritic cells infiltration in pan-cancer (Figure 4A and Supplementary Figure 6), and a negative correlation between PFKFB3 expression level and NK cells and B cells infiltration in pan-cancer (Figure 4A and Supplementary Figure 6).
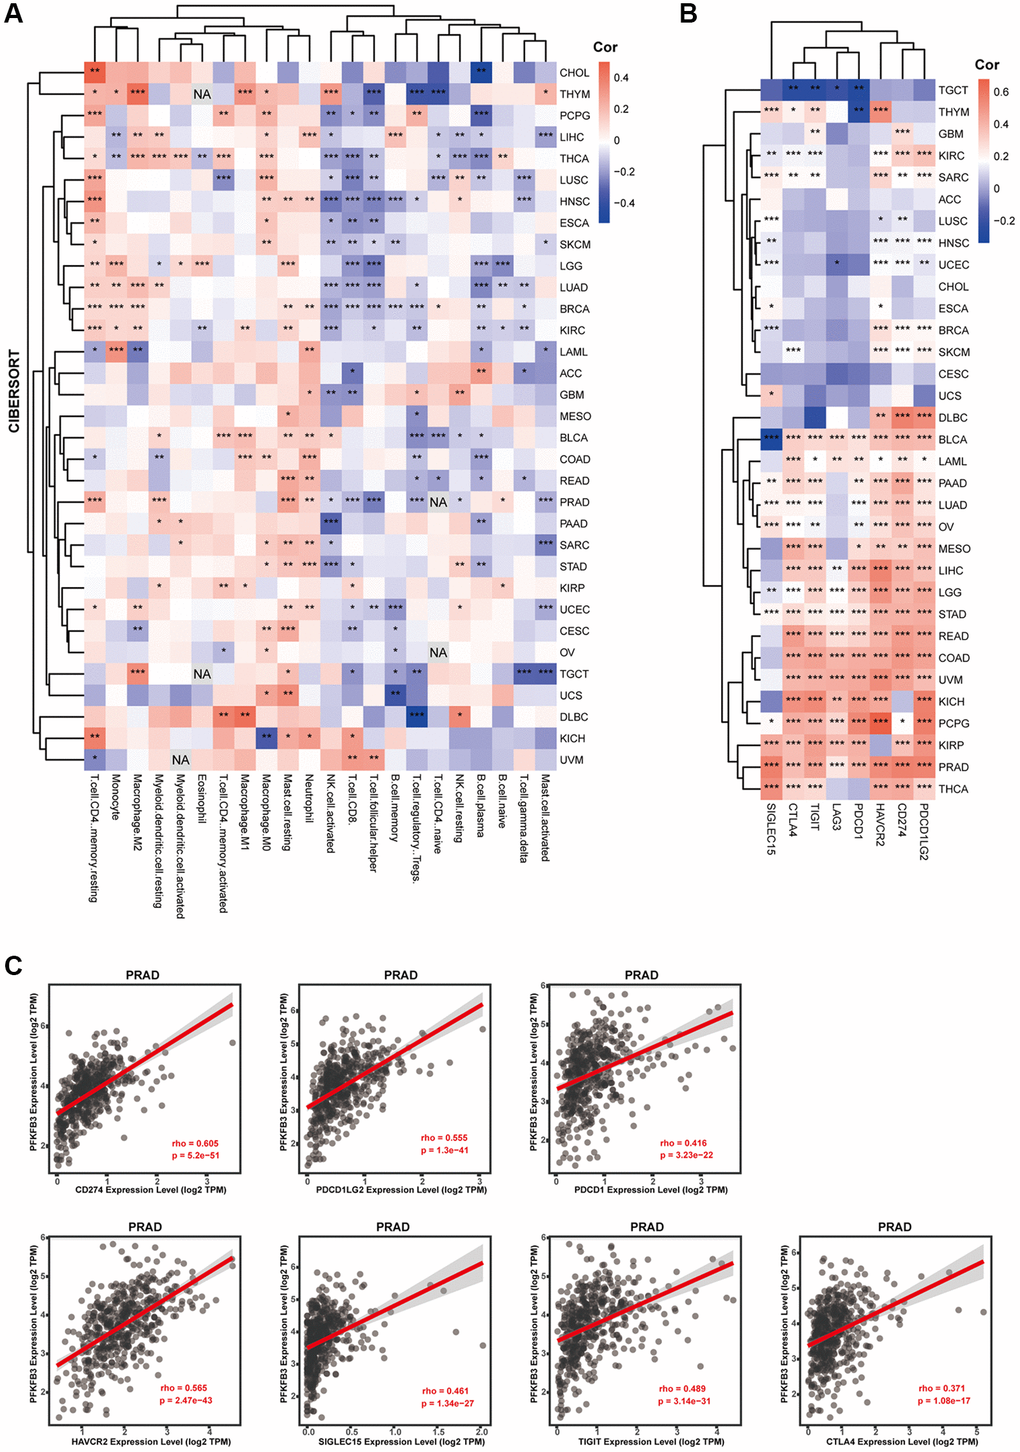
Figure 4. The correlation between PFKFB3 expression and immune infiltration or immune checkpoint in pan-cancer. (A) Correlation analysis between PFKFB3 expression and immunological infiltration in pan-cancer by CIBERSORT algorithm. (B) Correlation analysis between PFKFB3 expression and immune checkpoint in pan-cancer. (C) The association between PFKFB3 expression and CD274, PDCD1LG2, and PDCD1, HAVCR2, SIGLEC15, TIGIT, and CTLA4 in PRAD. All data *P < 0.05; **P < 0.01; ***P < 0.001.
Immune checkpoint contributes to the evasion of the immune system by tumor cells. Therefore, immune checkpoint blockade therapy has become one of the major strategies in fighting cancer [15]. Next, we investigated the correlation between PFKFB3 expression and the expression of immune checkpoint markers in pan-cancer, including programmed cell death 1 (PDCD1), programmed cell death 1 ligand 2 (PDCD1LG2), CD274, cytotoxic T-lymphocyte associated protein 4 (CTLA4), hepatitis A virus cellular receptor 2 (HAVCR2), lymphocyte activating 3 (LAG3), and sialic acid binding Ig like lectin 15 (SIGLEC15). Intriguingly, our results show that PFKFB3 expression was remarkably significantly correlated with the expression of almost all these immune checkpoint markers in 17 types of tumors, including BLCA, LAML, PAAD, LUAD, OV, MESO, LIHC, LGG, STAD, READ, COAD, UVM, KICH, pheochromocytoma and paraganglioma (PCPG), KIRP, PRAD, and THCA (Figure 4B). PFKFB3 expression correlated with CD274 (rho = 0.605, p = 5.2e-51), PDCD1LG2 (rho = 0.555, p = 1.3e-41), PDCD1 (rho = 0.416, p = 3.23e-22), HAVCR2 (rho = 0.565, p = 2.47e-43), SIGLEC15 (rho = 0.461, p = 1.34e-27), TIGIT (rho = 0.489, p = 3.14e-31), CTLA4 (rho = 0.371, p = 1.08e-17) expression in PRAD as a representative, respectively (Figure 4C).
Analysis of the relationship of PFKFB3 expression and immunoregulators in pan-cancer
Gene co-expression analysis was performed to study the relationship between PFKFB3 and immunoregulators. The immune-related genes of immunoinhibitory factors (Figure 5A), immunostimulatory factors (Figure 5B), MHC molecule (Figure 5C), and chemokine (Figure 5D) were examined, respectively. Our results indicated that almost all the immunoregulators were significantly positively correlated with PFKFB3 expression. The scatter plot shows that PFKFB3 positively correlated with colony-stimulating factor 1 receptor (CSF1R) (rho = 0.503, p < 2.2e-16), transmembrane protein 173 (TMEM173) (rho = 0.622, p < 2.2e-16), major histocompatibility complex, class II, DO alpha (HLA-DOA) (rho = 0.537, p < 2.2e-16), and C-X3-C motif chemokine ligand 1 (CX3CL1) (rho = 0.62, p < 2.2e-16) expression in PRAD as a representative, respectively (Figure 5E).
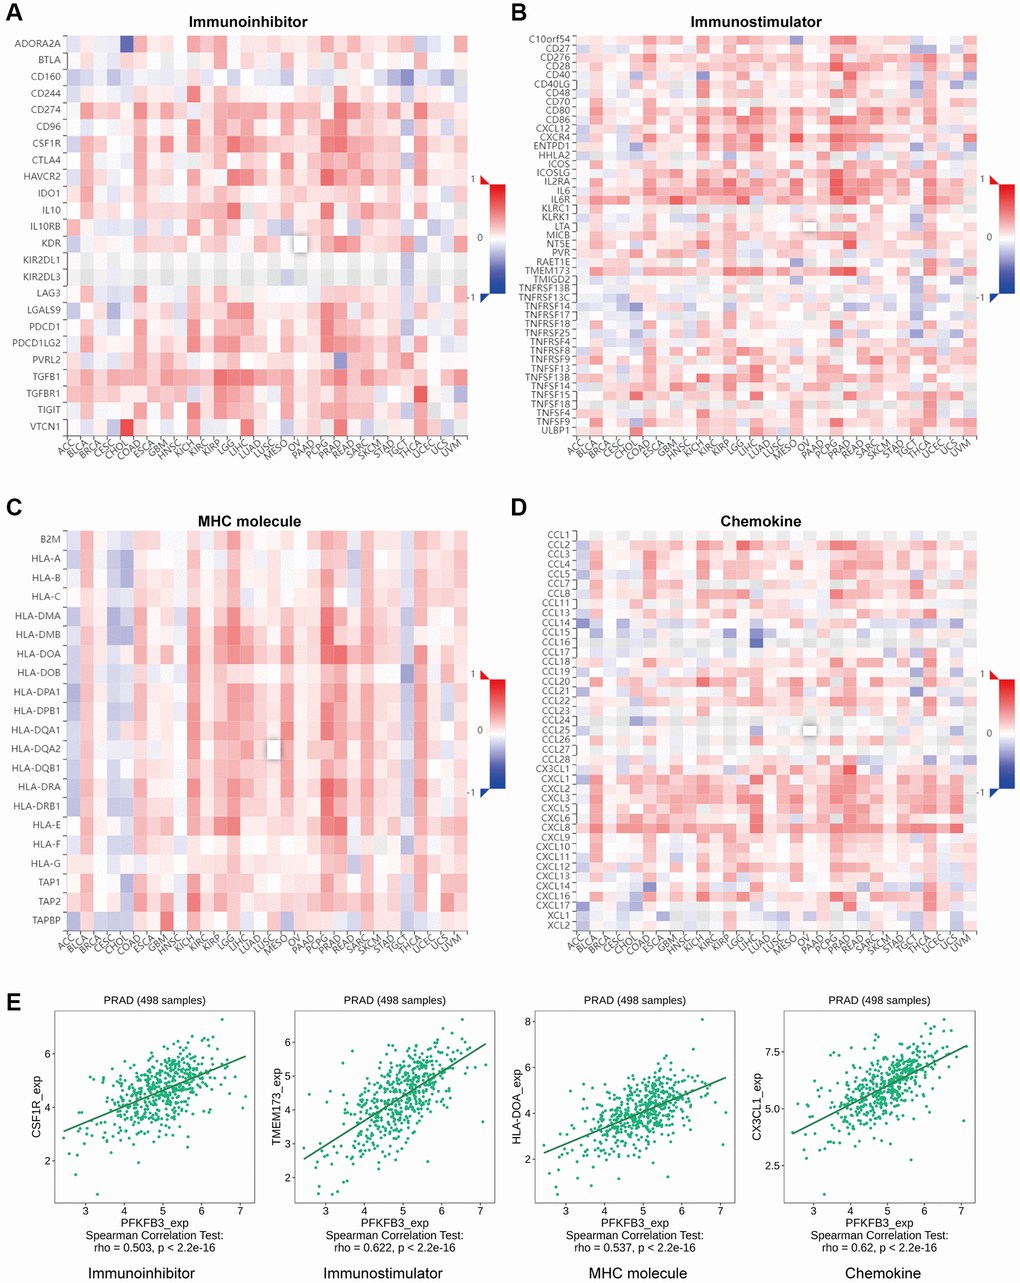
Figure 5. The association between PFKFB3 gene mutation and immune regulators in pan-cancer. The heatmaps about the relationship between PFKFB3 expression and immune markers: (A) immunoinhibitory factors; (B) immunostimulatory factors; (C) MHC molecule; (D) Chemokine. (E) The expression of PFKFB3 correlated with corresponding immune markers (CSF1R, TMEM173, HLA-DOA, and CX3CL1) in PRAD.
Single-cell analyzing the characteristic of the expression of PFKFB3 in TME in pan-cancer
Tumor Immune Single Cell Hub (TISCH) is a large-scale curated database that integrates single-cell transcriptomic profiles of nearly 2 million cells from 76 high-quality tumor datasets across 27 cancer types, which contribute to the comprehensive exploration of TME [16]. Firstly, we utilize TISCH to visualize UMAP plots and explore the character of the expression of PFKFB3 at the single-cell resolution in pan-caner (Figure 6A). Besides, we further analyzed the distribution of the PFKFB3 expression in different TME cells in pan-cancer (Figure 6B). Finally, we explore the PFKFB3 expression at the cell-type averaged level and display using a heatmap (Figure 6C). For cancer type, combining these results indicated that PFKFB3 has a remarkably high expression in TME in colorectal cancer (CRC) and HNSC (Figure 6). For the TME cell type, these results indicated that PFKFB3 has a remarkably high expression in Monocyte/Macrophage (Figure 6).
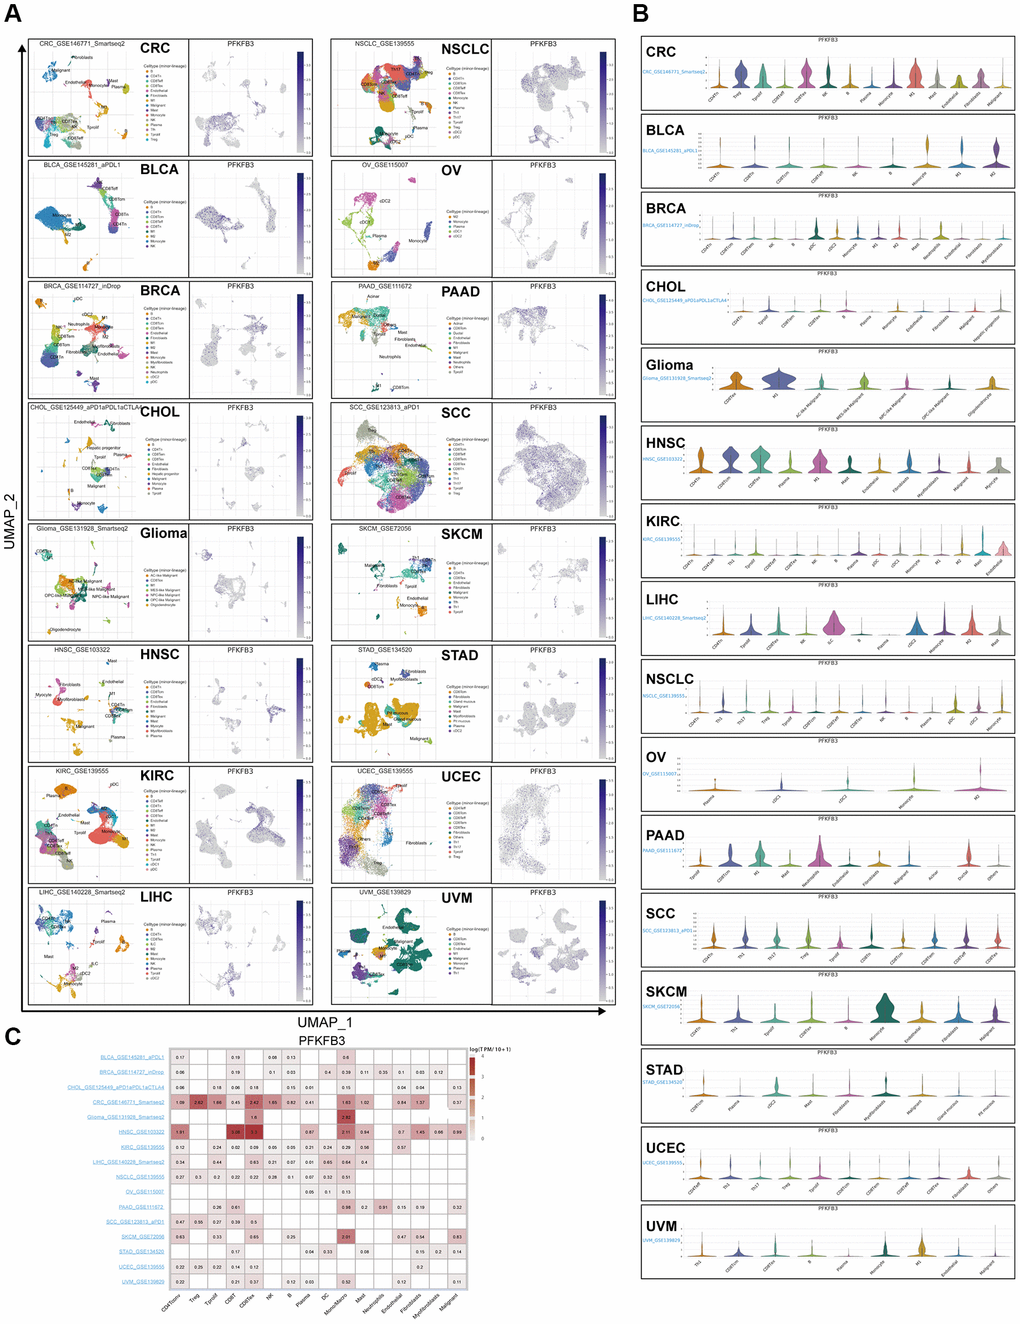
Figure 6. Single-cell analyze the characteristic of the PFKFB3 expression in pan-cancer. (A) The visualized single-cell UMAP plots are to show the cell distribution of treatment response groups (left) and the expression of PFKFB3 (right). (B) The grid violin plot reflects the distribution of PFKFB3 expression in different cell types across all datasets with various cancers. (C) The heatmap reflects the distribution of PFKFB3 expression in different cell types across all datasets with various cancers.
Genes enrichment analysis of PFKFB3 in pan-cancer
To analyze the roles of PFKFB3 in tumorigenesis, we screen out correlated genes of PFKFB3 in pan-cancer and the PFKFB3 interacting proteins for pathway enrichment analyses. And then, we used the GEPIA2 to obtain the top 100 PFKFB3 correlated genes based on all types of cancers in the TCGA database. We found PFKFB3 expression was positively correlated with Fasciculation and elongation protein zeta 2 (FEZ2, R-0.45), Reticulon 4 (RTN4, R = 0.44), Janus kinase-1 (JAK1, R = 0.43), Anoctamin-6 (ANO6, R = 0.41), BCL2/adenovirus E1B interacting protein 3-like (BNIP3L, R = 0.41), WD repeat and FYVE domain containing 3 (WDFY3) (R = 0.38, all p < 0.001, Figure 7A). The heatmap showed that PFKFB3 expression was positively correlated with the above six genes almost in complete cancer types (Figure 7B). We used the GSCALite websites to analyze the function of these top 6 PFKFB3 correlated genes in SNV frequency and pathway activity. SNV frequency data show the mutate frequency of WDFY3 (56%), JAK1 (24%), ANO6 (17%), RTN4 (17%), FEZ2 (5%), and BNIP3L (2%) (Figure 7C). Pathway activity analysis shows that these top 6 genes mainly activate epithelial-mesenchymal transition (EMT), RAS/MAPK, and Ras oncogene at 85D (RTK) pathways, and inhibit cell cycle and DNA damage response in pan-cancer (Figure 7D). Furthermore, we utilized the GSCALite and the cancer therapeutics response portal (CTRP) database to analyze the drug sensitivity of PFKFB3-related genes in KIRP (Supplementary Figure 7). The results showed that the expression of PFKFB3 was highly correlated with drug sensitivity, which suggests that PFKFB3 has a potential to be a therapy target in tumors.
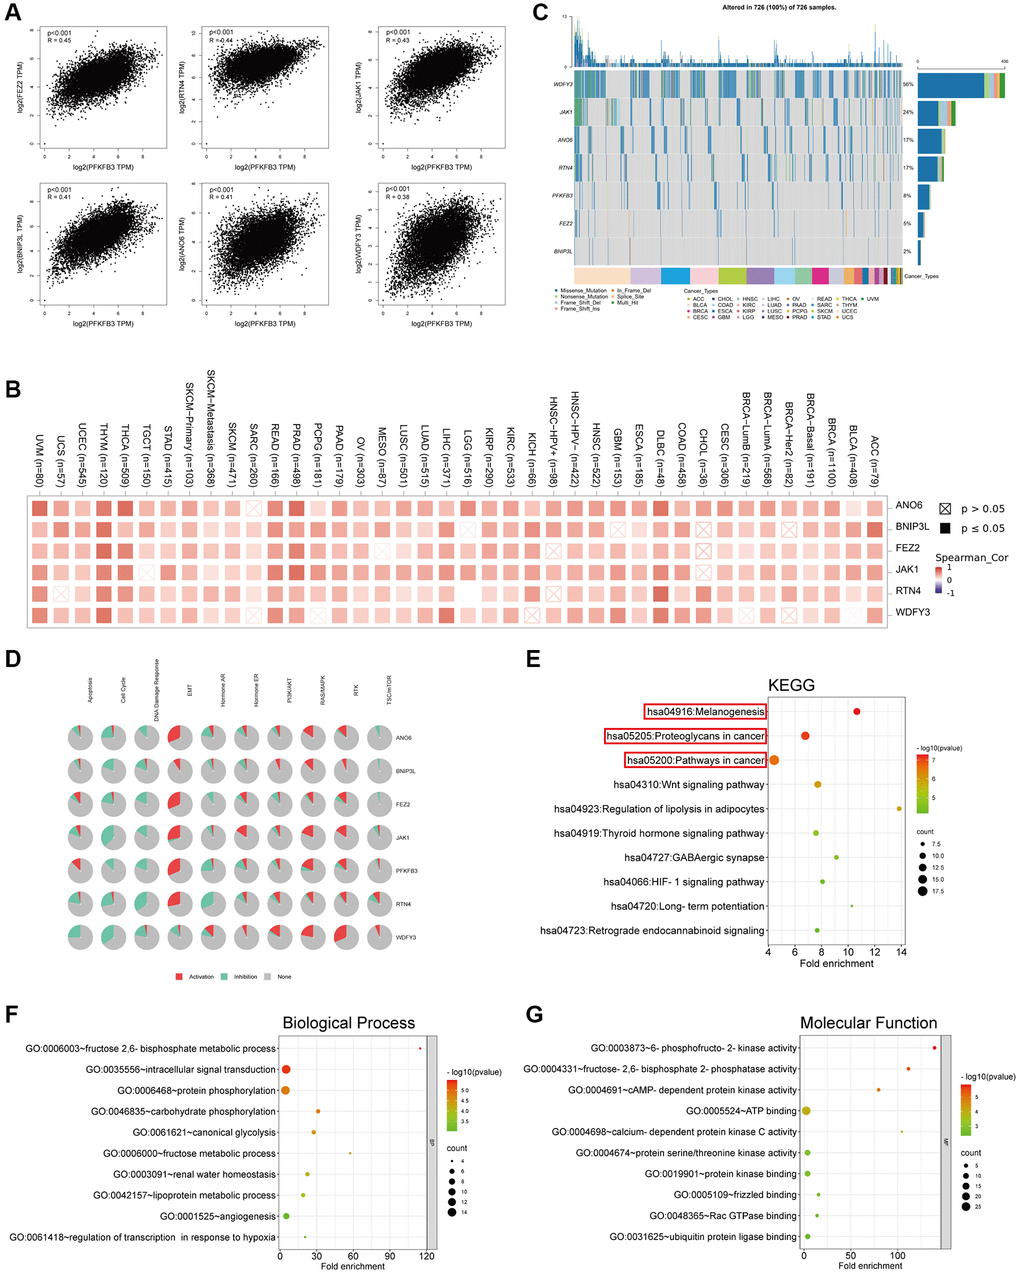
Figure 7. Genes enrichment analysis of PFKFB3 in pan-cancer. (A) The association between PFKFB3 and representative genes among the top PFKFB3-related genes analyzed by GEPIA2 in pan-cancer. (B) Heatmap shows the correlation between PFKFB3 and selected genes in pan-cancer. (C) Single Nucleotide Variation (SNV) frequency analysis of selected genes in pan-cancer. (D) Pathway activity analysis of selected genes in pan-cancer. (E) KEGG pathway analysis of PFKFB3-binding proteins and PFKFB3-correlated gene. (F, G) Go analysis of PFKFB3-binding proteins and PFKFB3-correlated gene, biological process (F), molecular function (G).
We utilized STRING to obtain the top 50 PFKFB3-binding proteins, which were supported by experimental evidence (Supplementary Figure 8) [17, 18]. We combined the two datasets, PFKFB3-binding proteins and top 100 PFKFB3 correlated genes, to analyze KEGG and GO enrichment. KEGG results showed that PFKFB3 correlated genes were involved in melanogenesis, proteoglycans in cancer, and pathways in the cancer pathway (Figure 7E). The GO enrichment results suggested that PFKFB3 correlated genes were linked to metabolic, intracellular signal transduction, and kinase activity (Figure 7F, 7G).
Establishment and evaluation of prognostic risk models in KIRP
Furthermore, we collected KIRP expression data and clinical data from TCGA public databases. In univariate regression analysis, clinical_stage, platelet_qualitative_result, and expression level of PFKFB3 were shown to be prognostic variables for the prognosis of OS in KIRP patients (Figure 8A). Moreover, multivariate regression Cox analysis indicated that PFKFB3 expression was an independent prognostic factor for KIRP (Figure 8B). Therefore, we utilize the expression of the PFKFB3 level to calculate the prognostic risk score. Then, the KIRP patients were divided into a high-risk group and a low-risk group by median of the risk score. The OS between different groups was compared by Kaplan-Meier analysis with the Log-rank test. The results suggested that the high-risk groups showed a poor prognosis compared with the low group (Figure 8C). The heatmap of prognosis signature after risk score grouping and the distribution of risk status and risk score were shown in Figure 8D. The 1-year and 3-year ROC curves were analyzed to evaluate the predictive accuracy of the PFKFB3 signature (Figure 8E). Moreover, the risk prognostic model was established based on prognostic factors of clinical_stage, platelet_qualitative_result, and expression level of PFKFB3 (P < 0.05), and the 1-, 3-years survival was given (Figure 8F). The calibration curves of 1- and 3-year survival of risk indicated the model has a good predictive ability (Figure 8G). Finally, we found that PFKFB3 was involved in the regulation of the immune system process (Supplementary Figure 9), and PFKFB3 was significantly positively correlated with immune checkpoints including PDCD1LG2 (rho = 0.468, p = 3.61e-17), TIGIT (rho = 0.439, p = 4.14e-15), PDCD1 (rho = 0.355, p = 4.72e-10), and CD274 (rho = 0.34, p = 2.86e-09, Figure 8H) in KIRP. Combining these results implicated that PFKFB3 may play a key role in immune infiltration in the TME and as a valuable prognostic factor in KIRP.
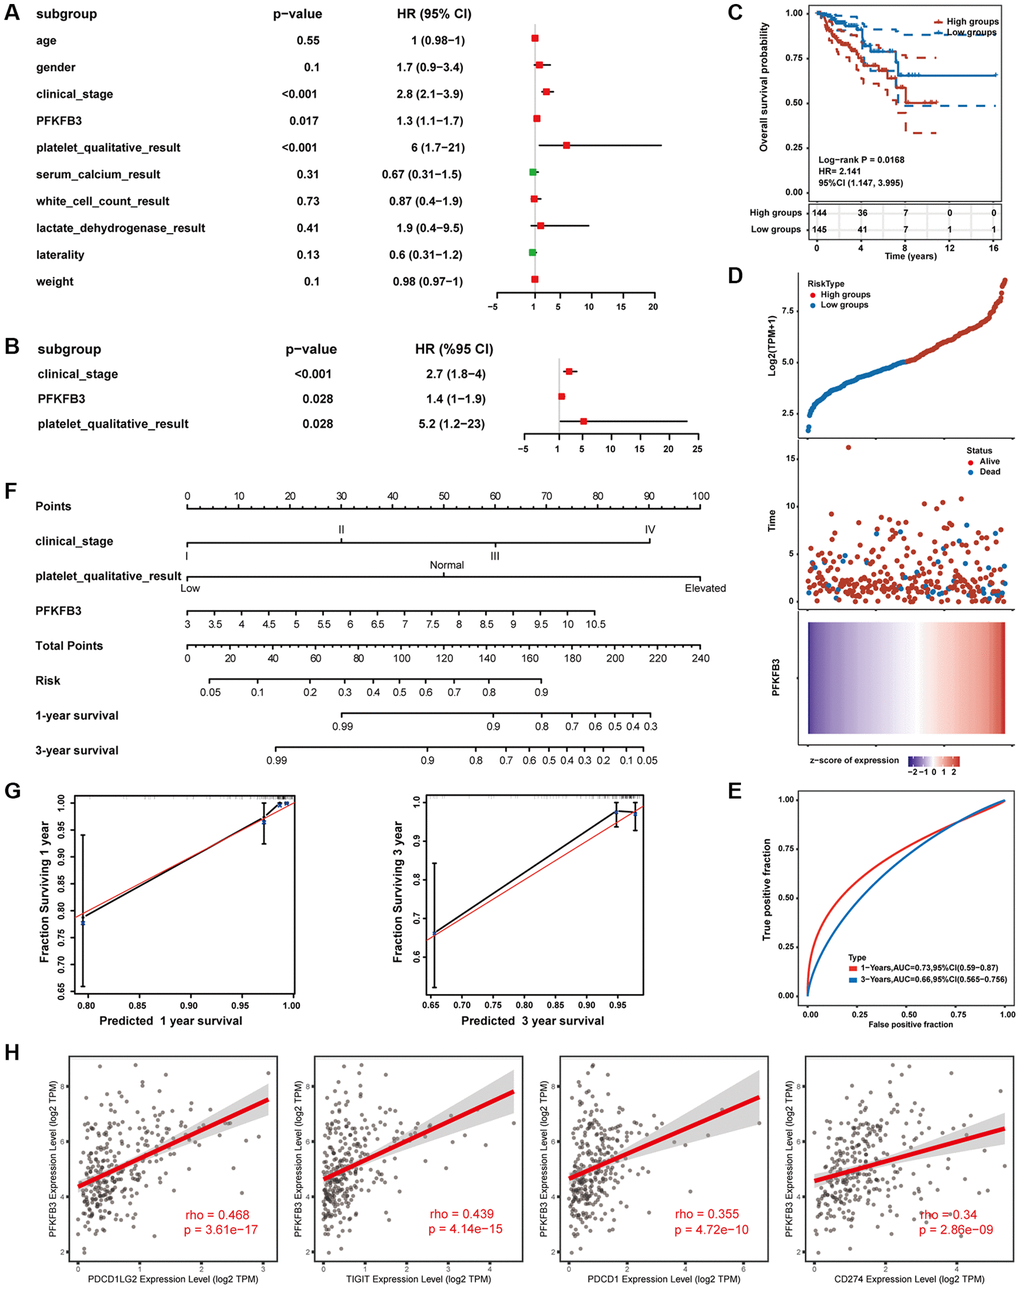
Figure 8. Establishment and evaluation of prognostic risk models. (A) Univariate Cox regression analysis. (B) Multivariate Cox regression analysis. (C) The survival status in high PFKFB3 expression groups compared with low PFKFB3 expression groups. (D) The distribution of risk score, the distribution of OS status, and the heatmap of PFKFB expression after risk score grouping. (E) Receiver operating characteristic (ROC) curve analysis. (F) The risk prognostic model was established based on prognostic factors of clinical_stage, platelet_qualitative_result, and expression level of PFKFB3. (G) Calibration plot for the risk prognostic model. (H) PFKFB3 was significantly positively correlated with immune checkpoints including PDCD1LG2, TIGIT, PDCD1, and CD274.
Discussion
At present, it is still a big challenge to interpret the mechanism of tumor development and discover effective therapeutic strategies. TME is a key regulatory factor in tumors and contributes to the initiation, progression, and metastasis of tumors [10]. Prof. Warburg observed a phenomenon: normal cells rely primarily on mitochondrial oxidative phosphorylation to generate energy. However, most cancer cells instead rely on aerobic glycolysis, which is termed “the Warburg effect”, suggesting that glycolysis plays an important role in tumorigenesis [3]. PFKFB3 was a key regulatory enzyme in glycolysis. Multiple studies have indicated that PFKFB3 plays an important role in several malignancies. However, pan-cancer evidence has yet to be established to interpret the function of PFKFB3 in TME and the clinical prognosis of different cancers. Our study revealed novel insights into the function of PFKFB3 in tumorigenesis across thirty-three different tumors.
In this study, we conducted a comprehensive assessment of the relationship between PFKFB3 expression, patient prognosis, and especially TME in cancers based on the TCGA database. Firstly, we explored the mRNA expression level, protein expression level, and protein phosphorylation of PFKFB3 in multiple tumors using TCGA, CPTAC, and GTEx databases. The expression of PFKFB3 was significantly elevated in CHOL, COAD, HNSC, STAD, and THCA. In contrast, PFKFB3 expression was significantly reduced in BLCA, BRCA, KICH, KIRC, KIRP, LIHC, LUAD, LUSC, PRAD, DLBC, and THYM. The phosphorylation of PFKFB3 (Ser22, Ser441, and Ser461) was significantly increased in most tumors. While the functional consequence of phosphorylation at Ser22 and Ser441 is not yet clear, Ser461 has been established as an important modification site on PFKFB3. Protein kinase AMP-activated catalytic subunit alpha 1 (AMPK) enhances the glycolytic activity of PFKFB3 by phosphorylating PFKFB3 at Ser461, and therefore, promoting the proliferation of cancer cells [19].
We explored the relationship between PFKFB3 expression and the prognosis of different tumor patients. We found that high PFKFB3 expression was linked to poor prognosis in patients with ACC, COAD, KIRP, LIHC, SARC, STAD, and UVM. Low expression of the PFKFB3 gene was associated with poor prognosis for patients with KIRC. Aberrant expression of PFKFB3 is frequently found in breast cancer, colon cancer, pancreatic cancer, gastric cancer, liver cancer, and many other neoplasms [11]. In many types of cancer, high expression of PFKFB3 is associated with poor prognosis. PFKFB3 regulates tumor proliferation, invasiveness, and migration through different mechanisms. Previous studies reported that PFKFB3 impacts cancer cell proliferation by regulating the expression levels or post-transcriptional modification levels of cyclin-dependent kinase and thus influences cell cycle arrest in gastric cancer and cervical cancer [20–22]. PFKFB3 knockdown inhibited hepatocellular carcinoma cell proliferation by impairing DNA repair functions [23]. Moreover, a recent study suggested that PFKFB3 may be a novel epithelial-mesenchymal transition inducer and regulates the invasion and migration in nasopharyngeal carcinoma progression [24].
The deficiency of MMR leads to ineffective protection from autogenetic DNA damage, which affects genome stability [13]. A deficiency of MMR results in high MSI. High MSI, as well as high TMB, leads to produce an increase in neoantigen, which could then be recognized by immune cells, and finally, improve immune responses [12]. Therefore, TMB, MSI, and MMR are treated as a biomarker to judge whether tumor patients are suitable for immunotherapy. Our results indicated that PFKFB3 was highly significantly correlated with TMB, MSI, and MMR in numerous tumors. These findings suggest that considering PFKFB3 expression when assessing suitability for immunotherapy may benefit patients with relevant cancers.
TME is a key regulatory factor in the tumor, which is composed of tumor cells and stromal cells, mainly including cancer-associated fibroblast cells, endothelial cells, and lymphocytes. TME contributes to a suitable growth environment for tumor and helps cancer cell immune escape, therefore, progressing initiation, progression, and metastasis of the tumor [10]. Lymphocyte infiltrating is a key component of TME. The infiltration of immune cells into tumors correlates with patient outcomes [25]. High infiltration of TIGIT+ CD8+ T cells indicated poor prognosis in muscle-invasive bladder cancer [26]. Lactate dehydrogenase A (LDHA) plays an important role in glycolysis and regulates the abundance of lactate. The high expression level of LDHA was correlated with CD8+ T cells, neutrophils, and dendritic cells infiltrating and showed poor survival in COAD patients [27]. A recent study showed that high expression of PFKFB3 induces CD274 molecule (CD274) expression via activating the NF-κB signal pathway in monocytes, therefore inhibiting CD8+ T cell activity and poor prognosis in hepatocellular carcinoma patients [28]. PFKFB3-NF-κB signaling induced the production of CXCL2 and CXCL8 in tumor-infiltrating monocytes, increased levels of CXCL2 and CXCL8 in monocytes and promote infiltration of oncostatin M-producing neutrophils in human hepatocellular carcinoma tissues [29]. We found a significant positive association between PFKFB3 expression level and neutrophil, macrophage, and myeloid dendritic cells infiltration in pan-cancer; and a negative correlation between PFKFB3 expression level and NK cells and B cells infiltration in pan-cancer. Moreover, our results show that PFKFB3 expression was remarkably positively correlated with the expression of all 7 immune checkpoint markers in 17 types of tumors, including BLCA, LAML, PAAD, LUAD, OV, MESO, LIHC, LGG, STAD, READ, COAD, UVM, KICH, PCPG, KIRP, PRAD, and THCA, which indicated that PFKFB3 has a potential function to progress immune escape. Therefore, PFKFB3 expression has an opportunity to be treated as a therapeutic synergy target of an immune-checkpoint inhibitor. Furthermore, PFKFB3 positively correlated with immunoinhibitory factors, immunostimulatory factors, MHC molecule, and chemokine. Finally, single-cell analysis has shown the characteristic of the expression of PFKFB3 on different types of immune cells of TME in pan-cancer. Summary, these results confirmed that PFKFB3 is a potent regulatory factor for the TME, as it could regulate interactions between immune cells and tumors. However, the specific molecular mechanism of the crosstalk of PFKFB3 and TME is still unclear, and further research is needed to confirm.
We screen PFKFB3-binding proteins and PFKFB3 correlated genes across all tumors for enrichment analyses. The KEGG pathway results identified that PFKFB3 correlated genes were involved in melanogenesis, proteoglycans in cancer, and pathways in cancer. Pathway activity analysis showed that PFKFB3 correlated top 6 genes mainly activate EMT, RAS/MAPK, and RTK pathway, and inhibit cell cycle and DNA damage response in pan-cancer. These pathways are reflected in previous research. EMT has been implicated in carcinogenesis and confers metastatic properties upon cancer cells by enhancing mobility, invasion, and resistance to apoptotic stimuli [30]. Overexpression of PFKFB3 positively modulated cell proliferation, migration, and EMT in GC cells by activation of NF-κB signaling [31]. Inhibition of RAS down-regulates HIF-1alpha and reduces PFKFB3 expression and might therefore block invasiveness, survival, and angiogenesis in Glioblastoma multiforme [32]. PFKFB3 is a hub for coordinating cell cycle and glucose metabolism by binding CDK4 and inhibiting the degradation of CDK4 in breast cancer [33]. A key role for PFKFB3 enzymatic activity in homologous recombination repair was confirmed, a selective PFKFB3 inhibitor that could potentially be used as a strategy for the treatment of cancer [7]. The analysis of the pathway of PFKFB3 in pan-cancer can be used as a future reference for exploring clinical tumor therapy.
Finally, we collected KIRP expression data and clinical data from TCGA public databases. We confirmed that PFKFB3 was an independent prognostic factor for KIRP, and established a risk prognostic model based on the expression of PFKFB3 and clinical risk factor, which has a good predictive ability. A recent study indicated that PFKFB3 expression is an independent prognostic factor in HCC via multivariate analysis [23, 34]. Moreover, the significant correlation between the expression of PFKFB3 and immune cell infiltration was examined in KIRP. Notably, PFKFB3 was significantly positively correlated with immune checkpoints including PDCD1LG2, TIGIT, PDCD1, and CD274. These results indicated that PFKFB3 might interact with immune checkpoint and immune cell infiltration inflecting TME, and therefore progress cancer cell escape and affect the patient prognosis.
Conclusions
In this study, we conducted a comprehensive analysis of the relationship between PFKFB3 expression, patient prognostic, TMB, MSI, MMR, and especially TME in pan-cancer base on TCGA and GEO databases. We evidence the predictive ability of PFKFB3 in the prognosis of KIRP. Our study suggested that PFKFB3 is a potent regulatory factor for the TME and has the potential to be a valuable prognostic biomarker in human tumor therapy. This study’s majority of conclusions were based on the bioinformatic assay, which has some limitations. Therefore, further experimental studies are required to validate these conclusions to evidence the function of PFKFB3 in various tumors.
Materials and Methods
Gene expression analysis
We used TIMER2.0 (http://timer.cistrome.org/) [18, 35–38] to analyze the expression level of PFKFB3 between tumor and non-tumor tissues in different TCGA cancers. For tumors without non-tumor or with limited numbers of non-tumor tissues in TCGA, we used GEPIA2 (http://gepia2.cancer-pku.cn/#analysis) [39] to analyze the expression difference of PFKFB3 between tumor tissues and the non-tumor tissues, under the settings of log2 (fold change) cutoff = 1, P-value cutoff = 0.01, and “Match TCGA normal and GTEx data.”
We analyze PFKFB3 expression of different pathological stages in TCGA tumors via GEPIA2. The log2 [TPM (transcripts per million) + 1] transformed expression data were applied for the box or violin plots [40].
Protein expression and phosphorylation analysis
The UALCAN (http://ualcan.path.uab.edu/index.html) tool can analyze cancer Omics data. We used UALCAN and the Clinical Proteomic Tumor Analysis Consortium (CPTAC) dataset to conduct protein expression analysis [18, 41]. We examined the expression level of total PFKFB3 protein or the phosphorylated proteins (phosphorylation at S22, S461, and S441, NP_001300992.1) between primary tumor and non-tumor tissues. Seven tumor datasets can be used in this web, including breast cancer, ovarian cancer, colon cancer, clear cell renal cell carcinoma, UCEC, lung adenocarcinoma (LUAD), and pediatric brain cancer, respectively [18].
Survival analysis
We used the “Survival Analysis” module of GEPIA and Assistant for Clinical Bioinformatics (ACB, https://www.aclbi.com/) to analyze the overall survival (OS), progression-free survival (PFS), and disease-free survival (DFS) on PFKFB3 expression in different tumors. We used a cut-off value of 50% to classify the high-expression and low-expression cohorts. The log-rank test was used in the hypothesis test [18].
Genetic changes, SNV frequency, and drug sensitivity analysis
We used the cBioPortal database (https://www.cbioportal.org/) to queries of the genetic alteration characteristics of PFKFB3 [18, 42, 43] and chose the “TCGA Pan-Cancer Atlas Studies,” composed of 32 studies including 10967 samples. We used the “Cancer Types Summary” module of the cBioPortal database to analyze the alteration frequency, mutation type, and copy number alteration (CNA) across all TCGA tumors [18].
We used the GSCALite (http://bioinfo.life.hust.edu.cn/web/GSCALite/) to analyze SNV frequency, pathway activity, and drug Sensitivity [44].
TMB and MSI analysis
TMB and MSI scores were calculated based on mutational information from TCGA. We explored the correlation between PFKFB3 expression and TMB as well as MSI using Spearman’s method.
Immune infiltration analysis
We utilized TIMER and CIBERSORT methods to analyze the correlation of PFKFB3 expression and immune infiltration level in all TCGA tumors. We focused on 22 types of immune cells and cancer-associated fibroblast cells using Spearman’s Rho method. The P-values and Rho values were obtained via the purity-adjusted Spearman’s Rho. P < 0.05 was the significance threshold. The data were visualized as a scatter plot or a heatmap [18].
The correlation analysis of immunoregulators in pan-cancer
We used the TISIDB (http://cis.hku.hk/TISIDB/index.php) to explore the correlation of PFKFB3 with immune regulators, MHC molecules, and chemokine [45].
Single-cell analysis
Tumor Immune Single Cell Hub (TISCH) is a large-scale curated database that integrates single-cell transcriptomic profiles of nearly 2 million cells from 76 high-quality tumor datasets across 27 cancer types, which contribute to the comprehensive exploration of TME [16]. We utilized TISCH to study the characteristic of the expression of PFKFB3 in TME in pan-cancer.
Prognostic risk model modeling and evaluation
In this study, we collected kidney renal papillary cell carcinoma (KIRP) expression data and clinical data from TCGA (https://portal.gdc.cancer.gov/) public databases. Age, gender, clinical stage, platelet, serum calcium, white cell count, lactate dehydrogenase, laterality, weight, and the expression level of PFKFB3 were included in the univariate Cox regression analysis. And statistically significant (p < 0.05) was selected as prognostic factors to perform multivariate Cox regression analysis. And then the establishment of the prognostic risk model utilizes the above prognostic factors, provides the risk score, and plots the nomogram. The “survivalROC” R package was used to perform the time-dependent receiver operating characteristic curves (ROC) [46].
Data availability statement
The data can be found in TIMER2.0 (http://timer.cistrome.org/), GEPIA2 (http://gepia2.cancer-pku.cn/#analysis), UALCAN (http://ualcan.path.uab.edu/index.html), cBioPortal (https://www.cbioportal.org/), GEPIA2021 (http://gepia2021.cancer-pku.cn/sub-expression.html), Jvenn (http://www.bioinformatics.com.cn), STRING (https://string-db.org/), DAVID (https://david.ncifcrf.gov/tools.jsp), TISIDB (http://cis.hku.hk/TISIDB/index.php), TISCH (http://tisch.comp-genomics.org/home/), Metascape (http://www.metascape.org/), GSCALite (http://bioinfo.life.hust.edu.cn/web/GSCALite/), and ACB (https://www.aclbi.com/). Further inquiries can be e-mailed to the corresponding authors.
Supplementary Materials
Author Contributions
Qingen Da: Conceptualization, Methodology, Formal analysis, Funding acquisition, Writing-Original draft. Lei Huang: Data curation, validation. Zee Chen, Zhitong Jiang, Fang Huang, Tao Shen, and Zilong Yan: Writing-Reviewing and Editing. Can Huang and Jingjing Da: Methodology, Software. Xiaoqiang Ye, Jing Yi, Lu Sun, and Yu Huang: Resources. Mingming Ren, Jikui Liu, Kunfu Ouyang: Funding acquisition. Tao Wang, Zhen Han, Jikui Liu, and Kunfu Ouyang: Supervision. All authors have read, corrected, and approved the manuscript.
Acknowledgments
We thank TCGA, GEO, GTEx, TIMER2, GEPIA, UALCAN, CPTAC, cBioPortal, TISIDB, TISCH, DAVID, ACB, and STRING databases for allowing free access.
Conflicts of Interest
The authors declare no conflicts of interest related to this study.
Funding
This work was supported by the National key research and development program (2022YFB4600600), the National Natural Science Foundation of China (82103383, 82170235, 81970421), the Shenzhen Basic Research Foundation (JCYJ20190808174001746, JCYJ20210324105407019, JCYJ20220531094016036), the Shenzhen-Hong Kong Institute of Brain Science-Shenzhen Fundamental Research Institutions (2023SHIBS0004), the Sanming Project of Medicine in Shenzhen (No. SZSM201612021), the Scientific Research Foundation of Peking University Shenzhen Hospital (KYQD2022211).
Editorial Note
This corresponding author has a verified history of publications using a personal email address for correspondence.
References
- 1. Warburg O, Wind F, Negelein E. The metabolism of tumors in the body. J Gen Physiol. 1927; 8:519–30. https://doi.org/10.1085/jgp.8.6.519 [PubMed]
- 2. Warburg O. On the origin of cancer cells. Science. 1956; 123:309–14. https://doi.org/10.1126/science.123.3191.309 [PubMed]
- 3. Vander Heiden MG, Cantley LC, Thompson CB. Understanding the Warburg effect: the metabolic requirements of cell proliferation. Science. 2009; 324:1029–33. https://doi.org/10.1126/science.1160809 [PubMed]
- 4. Robinson AD, Eich ML, Varambally S. Dysregulation of de novo nucleotide biosynthetic pathway enzymes in cancer and targeting opportunities. Cancer Lett. 2020; 470:134–40. https://doi.org/10.1016/j.canlet.2019.11.013 [PubMed]
- 5. Okar DA, Manzano A, Navarro-Sabatè A, Riera L, Bartrons R, Lange AJ. PFK-2/FBPase-2: maker and breaker of the essential biofactor fructose-2,6-bisphosphate. Trends Biochem Sci. 2001; 26:30–5. https://doi.org/10.1016/s0968-0004(00)01699-6 [PubMed]
- 6. Schoors S, De Bock K, Cantelmo AR, Georgiadou M, Ghesquière B, Cauwenberghs S, Kuchnio A, Wong BW, Quaegebeur A, Goveia J, Bifari F, Wang X, Blanco R, et al. Partial and transient reduction of glycolysis by PFKFB3 blockade reduces pathological angiogenesis. Cell Metab. 2014; 19:37–48. https://doi.org/10.1016/j.cmet.2013.11.008 [PubMed]
- 7. Gustafsson NMS, Färnegårdh K, Bonagas N, Ninou AH, Groth P, Wiita E, Jönsson M, Hallberg K, Lehto J, Pennisi R, Martinsson J, Norström C, Hollers J, et al. Targeting PFKFB3 radiosensitizes cancer cells and suppresses homologous recombination. Nat Commun. 2018; 9:3872. https://doi.org/10.1038/s41467-018-06287-x [PubMed]
- 8. Wang C, Qu J, Yan S, Gao Q, Hao S, Zhou D. PFK15, a PFKFB3 antagonist, inhibits autophagy and proliferation in rhabdomyosarcoma cells. Int J Mol Med. 2018; 42:359–67. https://doi.org/10.3892/ijmm.2018.3599 [PubMed]
- 9. Zhang HS, Du GY, Zhang ZG, Zhou Z, Sun HL, Yu XY, Shi YT, Xiong DN, Li H, Huang YH. NRF2 facilitates breast cancer cell growth via HIF1α-mediated metabolic reprogramming. Int J Biochem Cell Biol. 2018; 95:85–92. https://doi.org/10.1016/j.biocel.2017.12.016 [PubMed]
- 10. Tiwari A, Trivedi R, Lin SY. Tumor microenvironment: barrier or opportunity towards effective cancer therapy. J Biomed Sci. 2022; 29:83. https://doi.org/10.1186/s12929-022-00866-3 [PubMed]
- 11. Kotowski K, Rosik J, Machaj F, Supplitt S, Wiczew D, Jabłońska K, Wiechec E, Ghavami S, Dzięgiel P. Role of PFKFB3 and PFKFB4 in Cancer: Genetic Basis, Impact on Disease Development/Progression, and Potential as Therapeutic Targets. Cancers (Basel). 2021; 13:909. https://doi.org/10.3390/cancers13040909 [PubMed]
- 12. Fumet JD, Truntzer C, Yarchoan M, Ghiringhelli F. Tumour mutational burden as a biomarker for immunotherapy: Current data and emerging concepts. Eur J Cancer. 2020; 131:40–50. https://doi.org/10.1016/j.ejca.2020.02.038 [PubMed]
- 13. Boland CR, Goel A. Microsatellite instability in colorectal cancer. Gastroenterology. 2010; 138:2073–87.e3. https://doi.org/10.1053/j.gastro.2009.12.064 [PubMed]
- 14. Fridman WH, Galon J, Dieu-Nosjean MC, Cremer I, Fisson S, Damotte D, Pagès F, Tartour E, Sautès-Fridman C. Immune infiltration in human cancer: prognostic significance and disease control. Curr Top Microbiol Immunol. 2011; 344:1–24. https://doi.org/10.1007/82_2010_46 [PubMed]
- 15. He X, Xu C. Immune checkpoint signaling and cancer immunotherapy. Cell Res. 2020; 30:660–9. https://doi.org/10.1038/s41422-020-0343-4 [PubMed]
- 16. Sun D, Wang J, Han Y, Dong X, Ge J, Zheng R, Shi X, Wang B, Li Z, Ren P, Sun L, Yan Y, Zhang P, et al. TISCH: a comprehensive web resource enabling interactive single-cell transcriptome visualization of tumor microenvironment. Nucleic Acids Res. 2021; 49:D1420–30. https://doi.org/10.1093/nar/gkaa1020 [PubMed]
- 17. Szklarczyk D, Gable AL, Lyon D, Junge A, Wyder S, Huerta-Cepas J, Simonovic M, Doncheva NT, Morris JH, Bork P, Jensen LJ, Mering CV. STRING v11: protein-protein association networks with increased coverage, supporting functional discovery in genome-wide experimental datasets. Nucleic Acids Res. 2019; 47:D607–13. https://doi.org/10.1093/nar/gky1131 [PubMed]
- 18. Cui X, Zhang X, Liu M, Zhao C, Zhang N, Ren Y, Su C, Zhang W, Sun X, He J, Gao X, Yang J. A pan-cancer analysis of the oncogenic role of staphylococcal nuclease domain-containing protein 1 (SND1) in human tumors. Genomics. 2020; 112:3958–67. https://doi.org/10.1016/j.ygeno.2020.06.044 [PubMed]
- 19. Bando H, Atsumi T, Nishio T, Niwa H, Mishima S, Shimizu C, Yoshioka N, Bucala R, Koike T. Phosphorylation of the 6-phosphofructo-2-kinase/fructose 2,6-bisphosphatase/PFKFB3 family of glycolytic regulators in human cancer. Clin Cancer Res. 2005; 11:5784–92. https://doi.org/10.1158/1078-0432.CCR-05-0149 [PubMed]
- 20. Yalcin A, Clem BF, Simmons A, Lane A, Nelson K, Clem AL, Brock E, Siow D, Wattenberg B, Telang S, Chesney J. Nuclear targeting of 6-phosphofructo-2-kinase (PFKFB3) increases proliferation via cyclin-dependent kinases. J Biol Chem. 2009; 284:24223–32. https://doi.org/10.1074/jbc.M109.016816 [PubMed]
- 21. Doménech E, Maestre C, Esteban-Martínez L, Partida D, Pascual R, Fernández-Miranda G, Seco E, Campos-Olivas R, Pérez M, Megias D, Allen K, López M, Saha AK, et al. AMPK and PFKFB3 mediate glycolysis and survival in response to mitophagy during mitotic arrest. Nat Cell Biol. 2015; 17:1304–16. https://doi.org/10.1038/ncb3231 [PubMed]
- 22. Calvo MN, Bartrons R, Castaño E, Perales JC, Navarro-Sabaté A, Manzano A. PFKFB3 gene silencing decreases glycolysis, induces cell-cycle delay and inhibits anchorage-independent growth in HeLa cells. FEBS Lett. 2006; 580:3308–14. https://doi.org/10.1016/j.febslet.2006.04.093 [PubMed]
- 23. Shi WK, Zhu XD, Wang CH, Zhang YY, Cai H, Li XL, Cao MQ, Zhang SZ, Li KS, Sun HC. PFKFB3 blockade inhibits hepatocellular carcinoma growth by impairing DNA repair through AKT. Cell Death Dis. 2018; 9:428. https://doi.org/10.1038/s41419-018-0435-y [PubMed]
- 24. Gu M, Li L, Zhang Z, Chen J, Zhang W, Zhang J, Han L, Tang M, You B, Zhang Q, You Y. PFKFB3 promotes proliferation, migration and angiogenesis in nasopharyngeal carcinoma. J Cancer. 2017; 8:3887–96. https://doi.org/10.7150/jca.19112 [PubMed]
- 25. Williams NC, O'Neill LAJ. A Role for the Krebs Cycle Intermediate Citrate in Metabolic Reprogramming in Innate Immunity and Inflammation. Front Immunol. 2018; 9:141. https://doi.org/10.3389/fimmu.2018.00141 [PubMed]
- 26. Liu Z, Zhou Q, Wang Z, Zhang H, Zeng H, Huang Q, Chen Y, Jiang W, Lin Z, Qu Y, Xiong Y, Bai Q, Xia Y, et al. Intratumoral TIGIT+ CD8+ T-cell infiltration determines poor prognosis and immune evasion in patients with muscle-invasive bladder cancer. J Immunother Cancer. 2020; 8:e000978. https://doi.org/10.1136/jitc-2020-000978 [PubMed]
- 27. Wang Y, Nie H, Liao Z, He X, Xu Z, Zhou J, Ou C. Expression and Clinical Significance of Lactate Dehydrogenase A in Colon Adenocarcinoma. Front Oncol. 2021; 11:700795. https://doi.org/10.3389/fonc.2021.700795 [PubMed]
- 28. Chen DP, Ning WR, Jiang ZZ, Peng ZP, Zhu LY, Zhuang SM, Kuang DM, Zheng L, Wu Y. Glycolytic activation of peritumoral monocytes fosters immune privilege via the PFKFB3-PD-L1 axis in human hepatocellular carcinoma. J Hepatol. 2019; 71:333–43. https://doi.org/10.1016/j.jhep.2019.04.007 [PubMed]
- 29. Peng ZP, Jiang ZZ, Guo HF, Zhou MM, Huang YF, Ning WR, Huang JH, Zheng L, Wu Y. Glycolytic activation of monocytes regulates the accumulation and function of neutrophils in human hepatocellular carcinoma. J Hepatol. 2020; 73:906–17. https://doi.org/10.1016/j.jhep.2020.05.004 [PubMed]
- 30. Mittal V. Epithelial Mesenchymal Transition in Tumor Metastasis. Annu Rev Pathol. 2018; 13:395–412. https://doi.org/10.1146/annurev-pathol-020117-043854 [PubMed]
- 31. Lei L, Hong LL, Ling ZN, Zhong Y, Hu XY, Li P, Ling ZQ. A Potential Oncogenic Role for PFKFB3 Overexpression in Gastric Cancer Progression. Clin Transl Gastroenterol. 2021; 12:e00377. https://doi.org/10.14309/ctg.0000000000000377 [PubMed]
- 32. Blum R, Jacob-Hirsch J, Amariglio N, Rechavi G, Kloog Y. Ras inhibition in glioblastoma down-regulates hypoxia-inducible factor-1alpha, causing glycolysis shutdown and cell death. Cancer Res. 2005; 65:999–1006. [PubMed]
- 33. Jia W, Zhao X, Zhao L, Yan H, Li J, Yang H, Huang G, Liu J. Non-canonical roles of PFKFB3 in regulation of cell cycle through binding to CDK4. Oncogene. 2018; 37:1685–98. https://doi.org/10.1038/s41388-017-0072-4 [PubMed]
- 34. Matsumoto K, Noda T, Kobayashi S, Sakano Y, Yokota Y, Iwagami Y, Yamada D, Tomimaru Y, Akita H, Gotoh K, Takeda Y, Tanemura M, Umeshita K, et al. Inhibition of glycolytic activator PFKFB3 suppresses tumor growth and induces tumor vessel normalization in hepatocellular carcinoma. Cancer Lett. 2021; 500:29–40. https://doi.org/10.1016/j.canlet.2020.12.011 [PubMed]
- 35. Li T, Fu J, Zeng Z, Cohen D, Li J, Chen Q, Li B, Liu XS. TIMER2.0 for analysis of tumor-infiltrating immune cells. Nucleic Acids Res. 2020; 48:W509–14. https://doi.org/10.1093/nar/gkaa407 [PubMed]
- 36. Li T, Fan J, Wang B, Traugh N, Chen Q, Liu JS, Li B, Liu XS. TIMER: A Web Server for Comprehensive Analysis of Tumor-Infiltrating Immune Cells. Cancer Res. 2017; 77:e108–10. https://doi.org/10.1158/0008-5472.CAN-17-0307 [PubMed]
- 37. Li B, Severson E, Pignon JC, Zhao H, Li T, Novak J, Jiang P, Shen H, Aster JC, Rodig S, Signoretti S, Liu JS, Liu XS. Comprehensive analyses of tumor immunity: implications for cancer immunotherapy. Genome Biol. 2016; 17:174. https://doi.org/10.1186/s13059-016-1028-7 [PubMed]
- 38. Xiao Z, Hu L, Yang L, Wang S, Gao Y, Zhu Q, Yang G, Huang D, Xu Q. TGFβ2 is a prognostic-related biomarker and correlated with immune infiltrates in gastric cancer. J Cell Mol Med. 2020; 24:7151–62. https://doi.org/10.1111/jcmm.15164 [PubMed]
- 39. Tang Z, Kang B, Li C, Chen T, Zhang Z. GEPIA2: an enhanced web server for large-scale expression profiling and interactive analysis. Nucleic Acids Res. 2019; 47:W556–60. https://doi.org/10.1093/nar/gkz430 [PubMed]
- 40. Zhao L, Wang B, Yang C, Lin Y, Zhang Z, Wang S, Ye Y, Shen Z. TDO2 knockdown inhibits colorectal cancer progression via TDO2-KYNU-AhR pathway. Gene. 2021; 792:145736. https://doi.org/10.1016/j.gene.2021.145736 [PubMed]
- 41. Chen F, Chandrashekar DS, Varambally S, Creighton CJ. Pan-cancer molecular subtypes revealed by mass-spectrometry-based proteomic characterization of more than 500 human cancers. Nat Commun. 2019; 10:5679. https://doi.org/10.1038/s41467-019-13528-0 [PubMed]
- 42. Gao J, Aksoy BA, Dogrusoz U, Dresdner G, Gross B, Sumer SO, Sun Y, Jacobsen A, Sinha R, Larsson E, Cerami E, Sander C, Schultz N. Integrative analysis of complex cancer genomics and clinical profiles using the cBioPortal. Sci Signal. 2013; 6:pl1. https://doi.org/10.1126/scisignal.2004088 [PubMed]
- 43. Cerami E, Gao J, Dogrusoz U, Gross BE, Sumer SO, Aksoy BA, Jacobsen A, Byrne CJ, Heuer ML, Larsson E, Antipin Y, Reva B, Goldberg AP, et al. The cBio cancer genomics portal: an open platform for exploring multidimensional cancer genomics data. Cancer Discov. 2012; 2:401–4. https://doi.org/10.1158/2159-8290.CD-12-0095 [PubMed]
- 44. Liu CJ, Hu FF, Xia MX, Han L, Zhang Q, Guo AY. GSCALite: a web server for gene set cancer analysis. Bioinformatics. 2018; 34:3771–2. https://doi.org/10.1093/bioinformatics/bty411 [PubMed]
- 45. Ru B, Wong CN, Tong Y, Zhong JY, Zhong SSW, Wu WC, Chu KC, Wong CY, Lau CY, Chen I, Chan NW, Zhang J. TISIDB: an integrated repository portal for tumor-immune system interactions. Bioinformatics. 2019; 35:4200–2. https://doi.org/10.1093/bioinformatics/btz210 [PubMed]
- 46. Song W, Shao Y, He X, Gong P, Yang Y, Huang S, Zeng Y, Wei L, Zhang J. IGFLR1 as a Novel Prognostic Biomarker in Clear Cell Renal Cell Cancer Correlating With Immune Infiltrates. Front Mol Biosci. 2020; 7:565173. https://doi.org/10.3389/fmolb.2020.565173 [PubMed]