Submit an Article
Navigate
Home
Editorial Board
Editorial Policies
Current Volume
Archive
Scientific Integrity
Publication Ethics Statements
Interviews with Outstanding Authors
Newsroom
Sponsored Conferences
Podcast
Contact
Special Collections
Submit an Article
Online ISSN: 1945-4589
Research Paper
|
Volume 15, Issue 11
|
pp. 4906–4925
A spliceosome-associated gene signature aids in predicting prognosis and tumor microenvironment of hepatocellular carcinoma
Back to article
Figure 4
(4 of 8)
−
100%
+
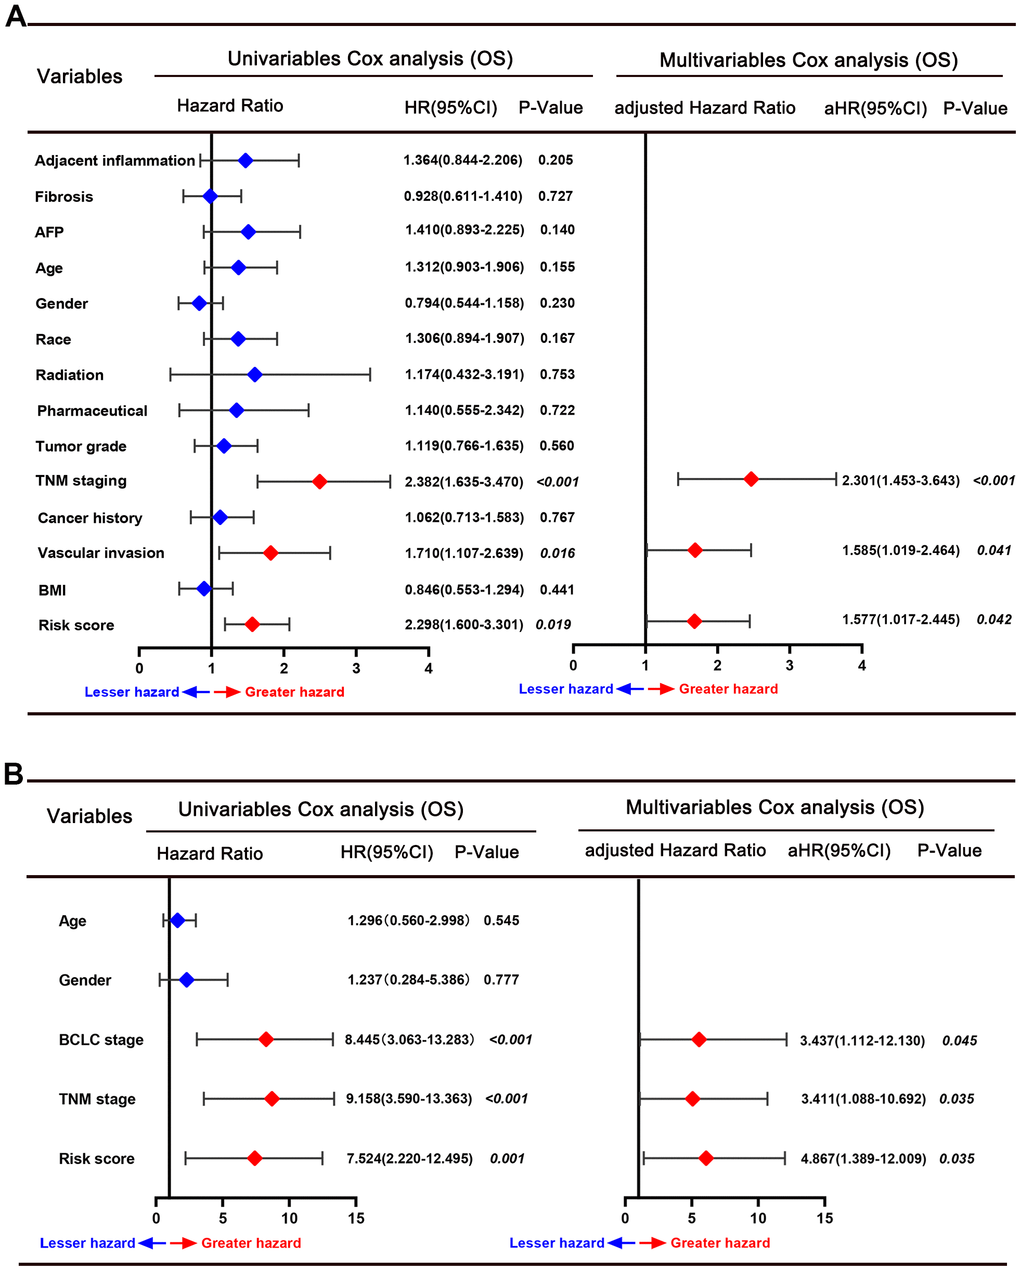
Figure 4.
Forrest plot of the univariate and multivariate Cox regression analyses for overall survival in the TCGA cohort (
A
) and GSE76427 cohort (
B
).
Figure 4 — A spliceosome-associated gene signature aids in predicting prognosis and tumor microenvironment of hepatocellular carcinoma | Aging