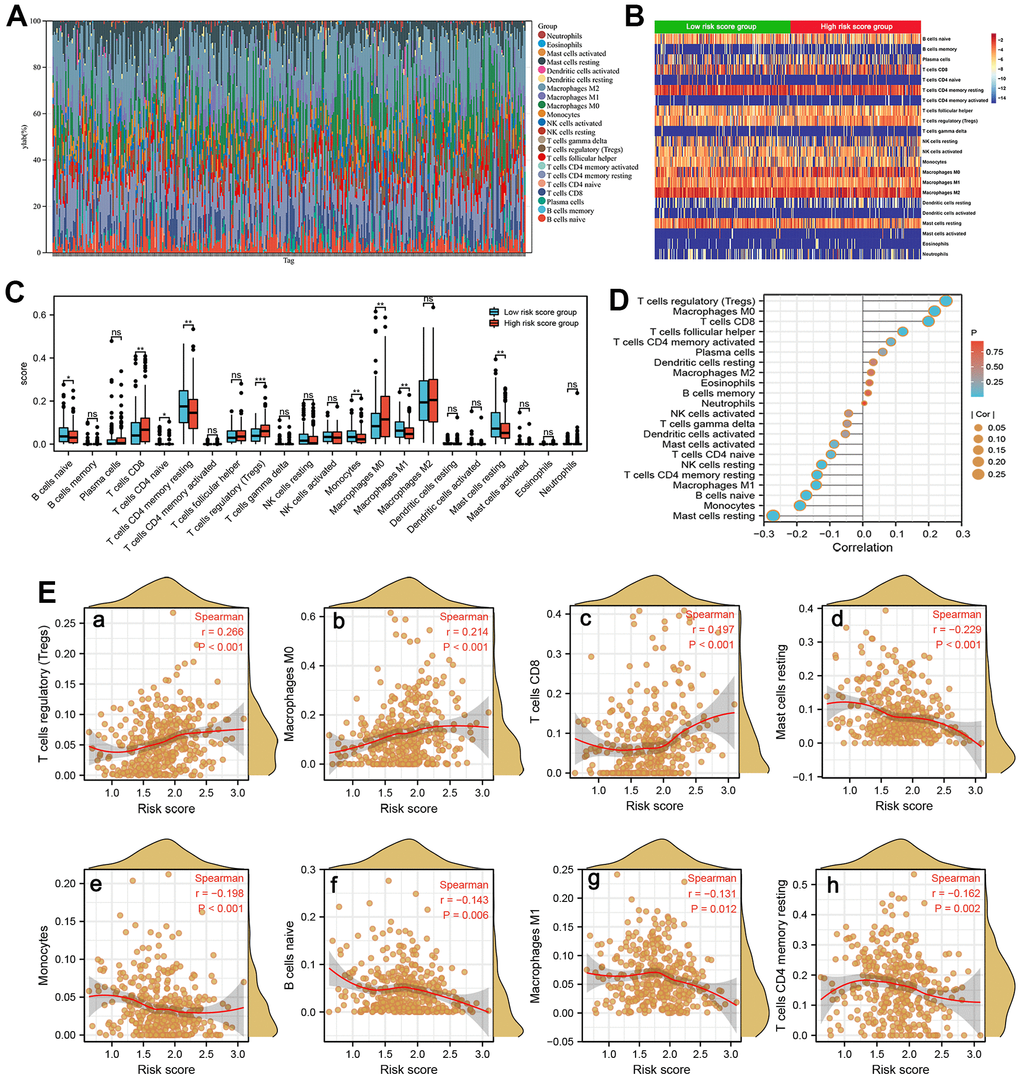
Figure 8.Immune infiltration analysis. (A) The estimated fractions of 22 immune cells in each HCC sample using the CIBERSORT algorithm and visualized in a bar plot. (B) The heat map exhibited the differences in the fraction of 22 immune cells between the high-risk score and low-risk score groups. (C) The comparison of estimated fractions of 22 immune cells between the high-risk and low-risk score groups. (D) The correlation between the risk score and 22 tumor-infiltrating immune cells in HCC using the ssGSEA algorithm. (E) The correlation of risk score with immune infiltration level of T cells regulatory (a), Macrophages M0 (b), T cells CD8 (c), Mast cell resting (d), Monocytes (e), B cells naive (f), Macrophages M1 (g), and T cells CD4 memory resting (h).