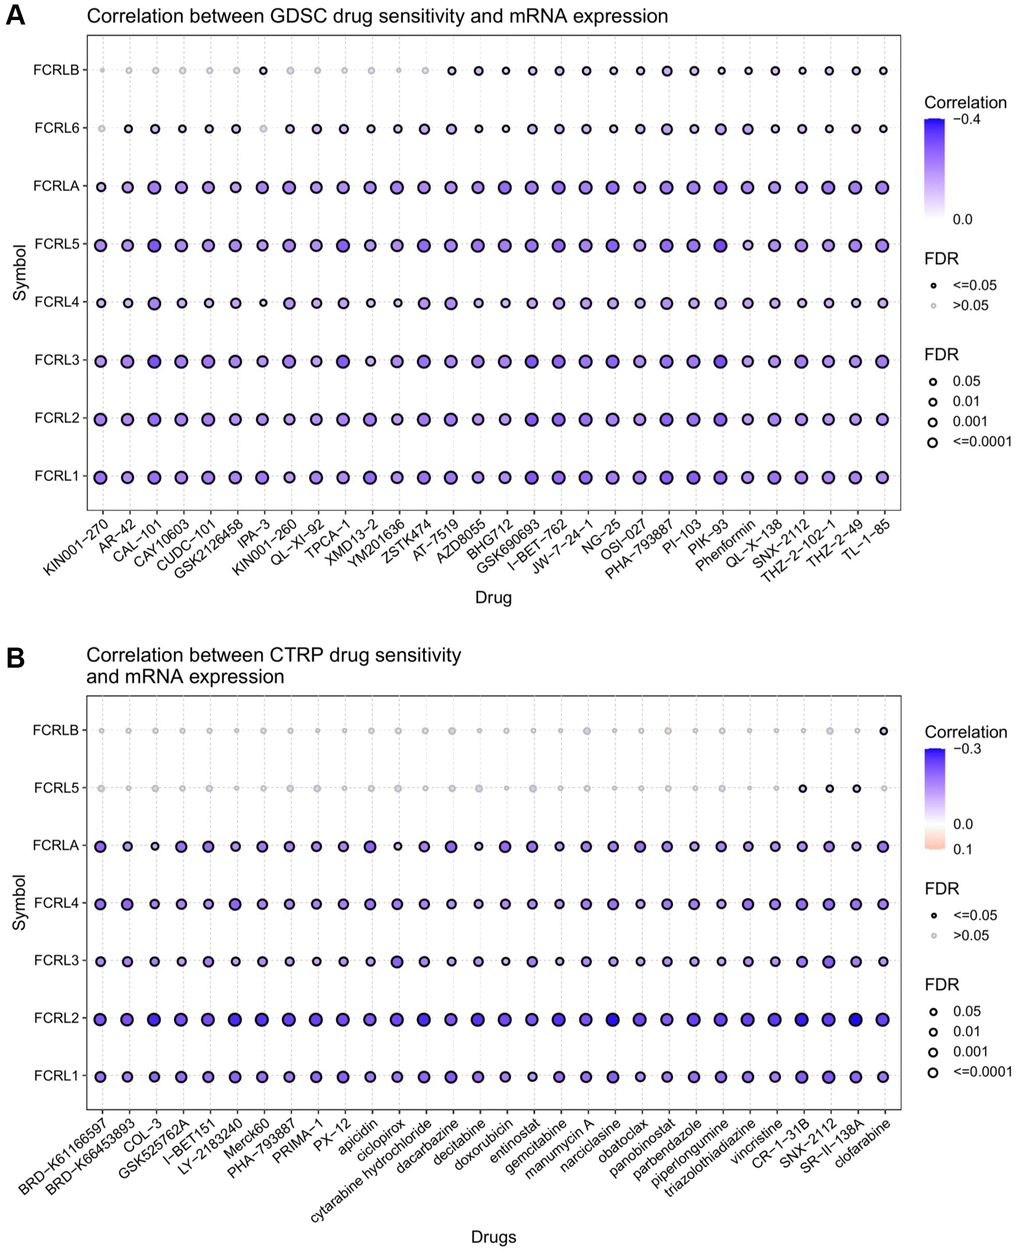
Figure 11.Drug sensitivity analysis of FCRL family gene. The correlation between FCRL family gene expression and drug sensitivity in (A) GDSC and (B) CTRP database. The correlation between gene expression and drug sensitivity was assessed using Pearson's correlation coefficient. Negative correlations were denoted by blue bubbles, while positive correlations were represented by red bubbles. The intensity of the color reflected the strength of the correlation, with darker hues indicating higher levels of correlation. The size of the bubbles was positively associated with the FDR significance, and bubbles outlined in black corresponded to an FDR < 0.05. Our analysis was limited to the top 30 ranked drugs.