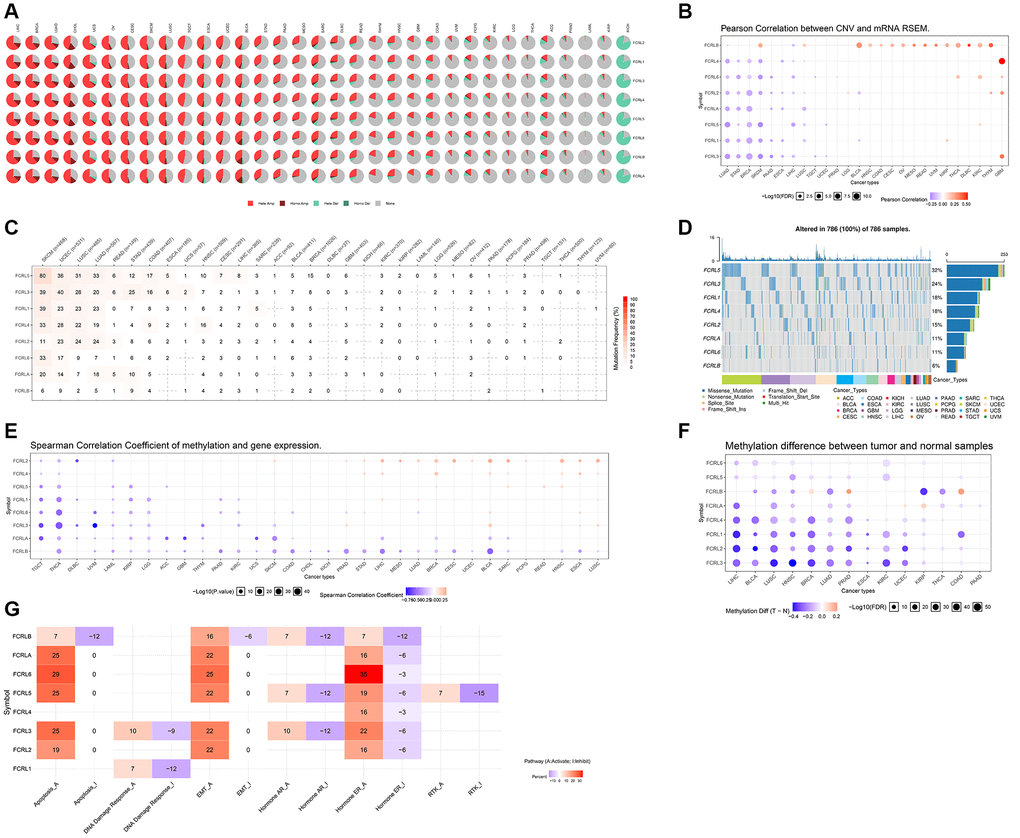
Figure 4.CNV, SNV and Methylation of FCRL family genes in pan-cancer. (A) CNV profiles of 33 cancer types’ FCRL family gene expression. Homo Amp stands for homozygous amplification, while Hete Amp and Hete Del stand for heterozygous amplification and deletion, respectively. (B) Correlation between CNV and the mRNA expression of genes from the FCRL family in 26 different cancer types. The darker the colour, the higher the correlation. Blue bubbles reflect a negative correlation, whereas red bubbles show a positive correlation. Each bubble's size indicates statistical significance. (C) SNV percentage profile of 32 cancer types’ associated FCRL family genes. (D) SNV frequency of genes from the FCRL family in all cancers. Patients are represented by the grey vertical bars in the graph. The number of variations per sample or in each gene is shown in the diagrams in the top and side columns. (E) Correlation between the expression levels of the genes in the FCRL family and their methylation status. Positive correlation is represented by red, while negative correlation is represented by blue. (F) Various FCRL family gene methylation patterns in 14 malignancies and healthy tissues. The darker the dots, the larger the changes in methylation up- and down-regulation in tumours are represented by blue and red dots. Statistics are indicated by the size of the dots. (G) Overall FCRL family gene pathway activity in 33 different cancer types. I stands for Inhibit, and A is for Activate.