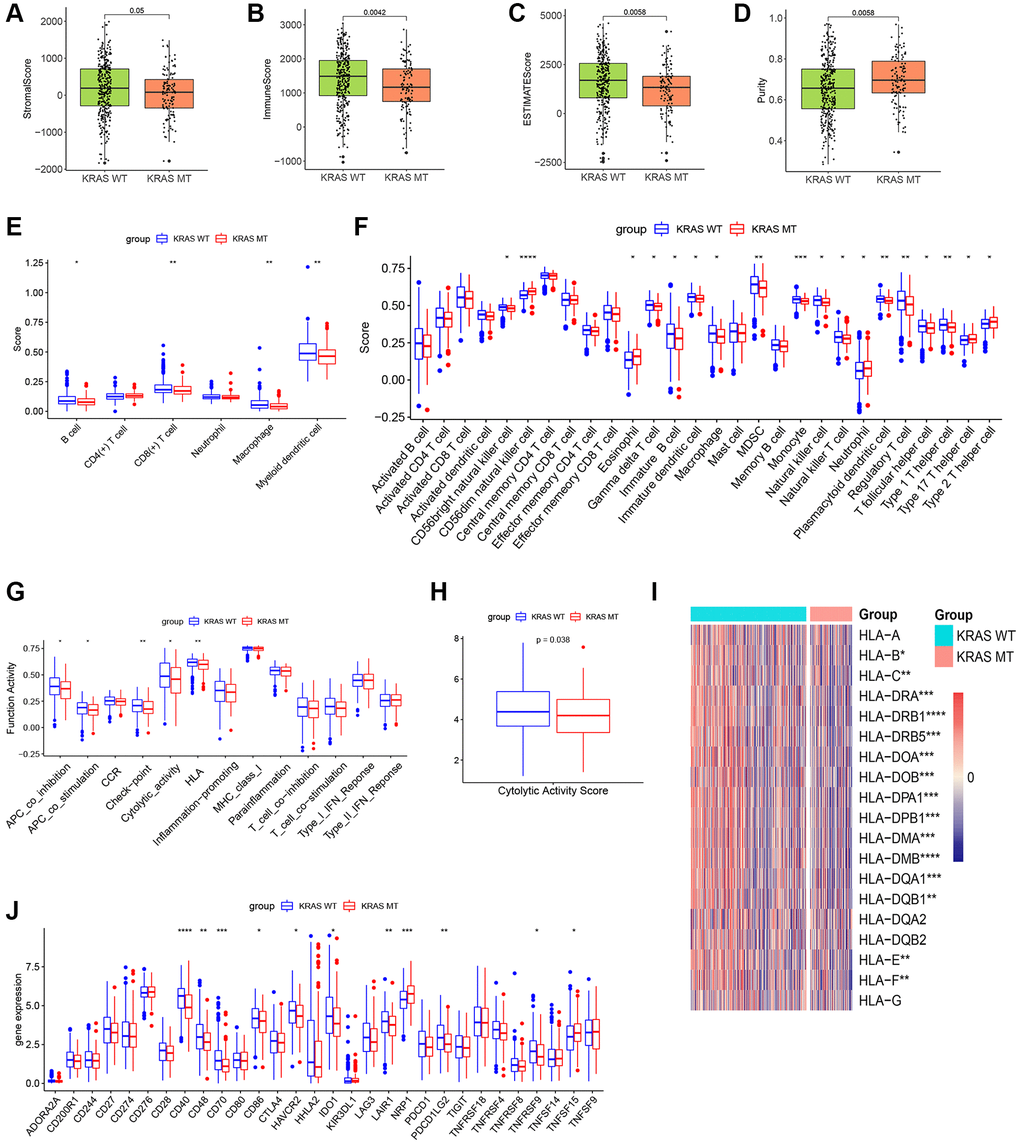
Figure 3.The plots of immune landscape KRAS-mutated and KRAS-wild groups. (A–D) Boxplots of the stromal score, immuno score, ESTIMATE score, and purity score in the 2 groups. (E) Boxplot of TIMER score in the 2 groups. (F) Boxplot of ssGSEA score of 28 immune cells in the 2 groups. (G) Boxplot of ssGSEA score of 13 immune functions in the 2 groups. (H) Boxplot of cytolytic activity score in the 2 groups. (I) Heatmap of expression values of HLA molecules in the 2 groups. (J) Boxplot of expression values of immune checkpoints in the 2 groups. (*p < 0.05, **p < 0.01, ***p < 0.001, ****p < 0.0001).