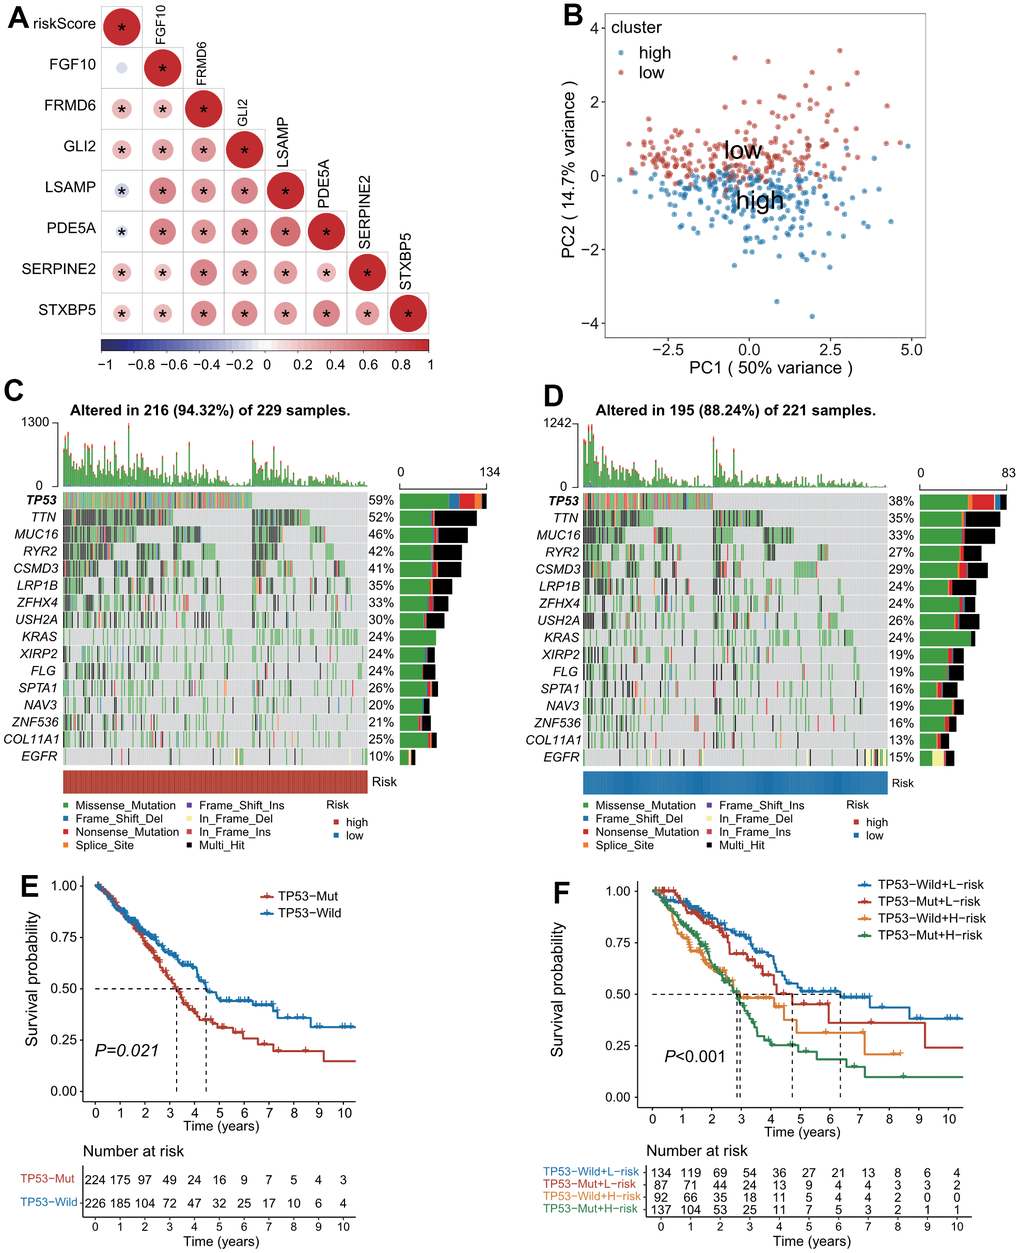
Figure 3.The landscape of genetic alterations stratified by CAFs-related risk signature (CAFRS). (A) A correlation diagram of risk score and expression levels of 7 CAFRS genes. (B) Principal component analysis of seven CAFRS genes to classify patients into low-risk and high-risk clusters. (C, D) Oncoplots depicting the top 15 mutational genes and EGFR between low- and high-risk subgroups. (E) Kaplan-Meier curves of all LUAD patients stratified by TP53 (with highest mutation rate) status. (F) Kaplan-Meier curves of all LUAD patients stratified by TP53 status and CAFRS scores.