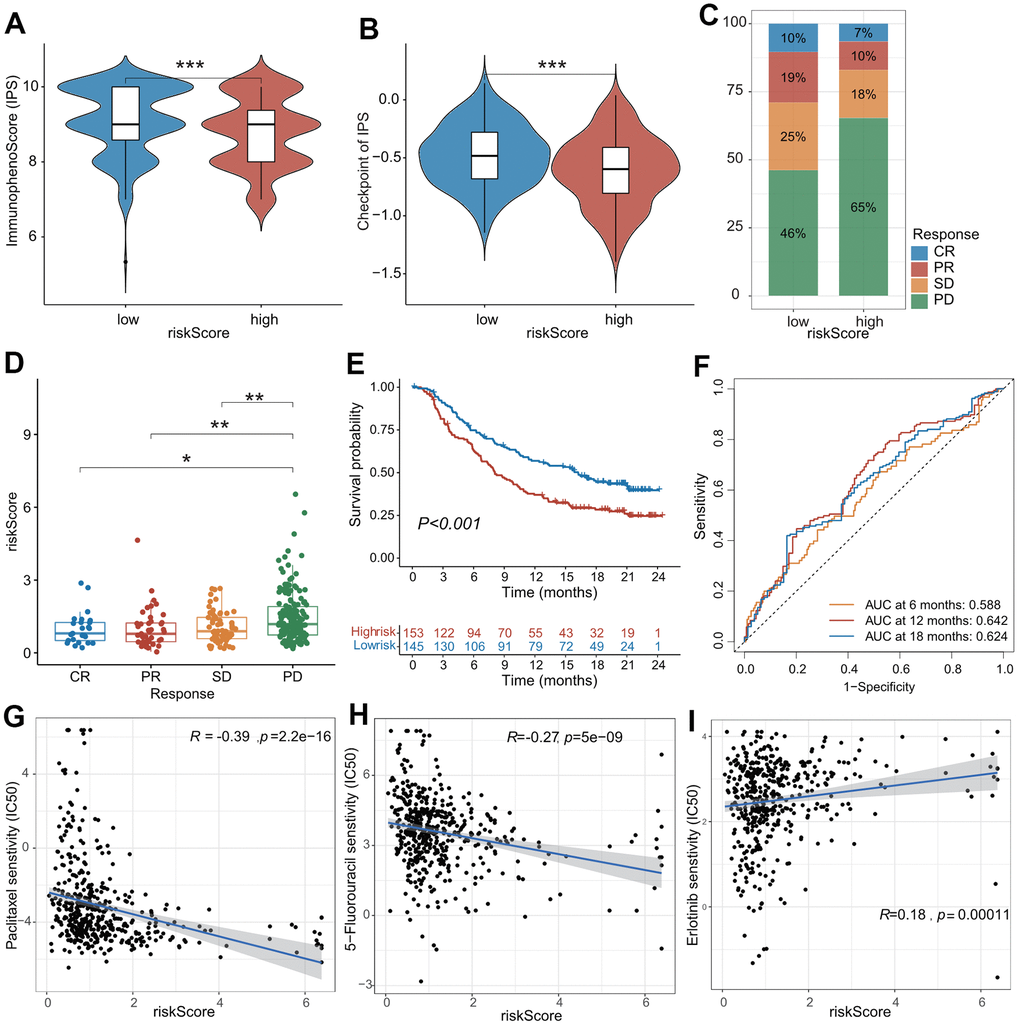
Figure 6.The role of CAFs-related risk signature (CAFRS) in predicting drug response. (A, B) The immunophenotype score (IPS) and one of its constituents-immune checkpoint score between low- and high-risk subgroups from TCGA cohort. (C) The proportion of patients with clinical response to anti-PD-1 immunotherapy in low- and high-risk subgroups from IMvigor210 cohort. SD, stable disease; PD, progressive disease; CR, complete response; PR, partial response. (D) The riskscore of CAFRS in the CR, PR, SD and PD subgroups. (E) Kaplan-Meier curves of patients from IMvigor210 cohort stratified by low- and high-risk subgroups. (F) The ROC curves illustrating the AUC values at 6-, 12- and 18-month. (G–I) The plots illustrating correlations of IC50 values for Paclitaxel, 5-FU and Erlotinib with CAFRS scores in TCGA cohort. (*P < 0.05, **P < 0.01, ***P < 0.001).