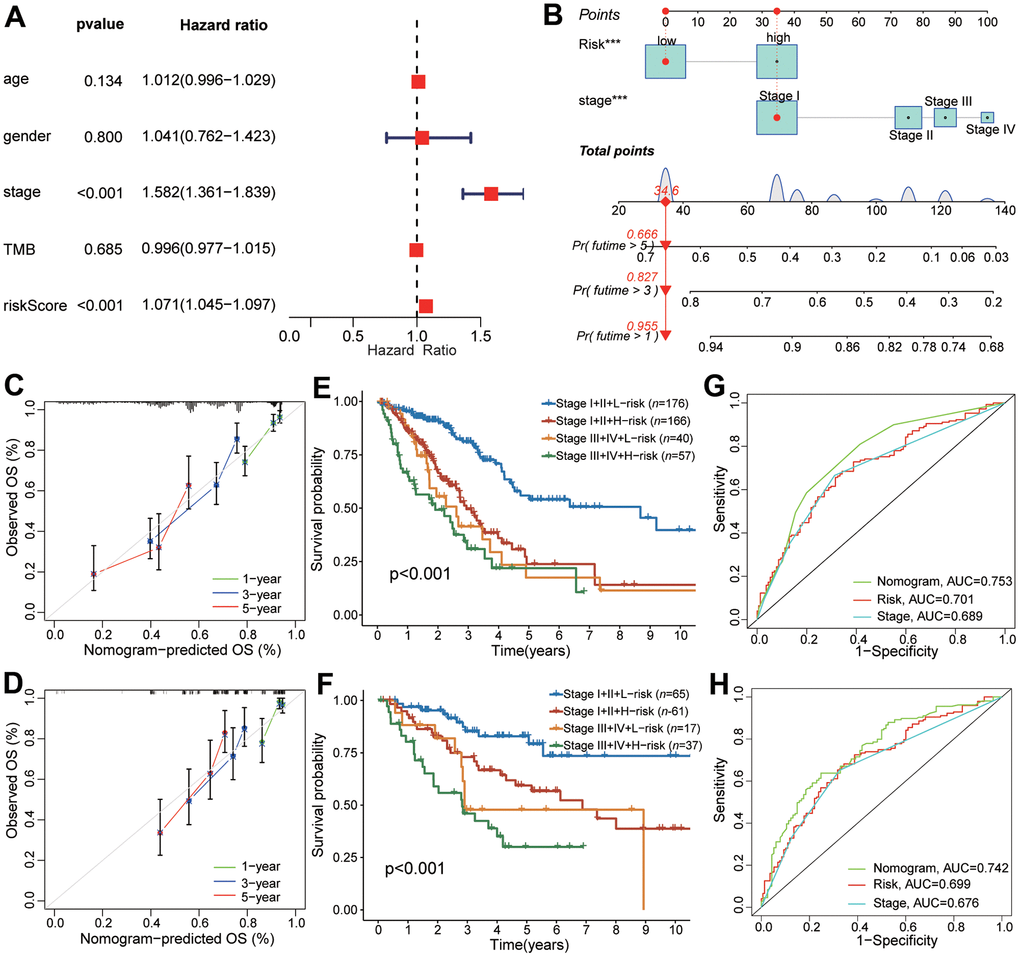
Figure 7.The predictive performance of CAFRS in combination with TNM stage in OS for LUAD patients. (A) The forest plot of multivariate Cox regression analysis for OS of TCGA-LUAD. (B) Nomogram of predicting 1-, 3-, and 5- year OS for TCGA-LUAD. (C, D) Calibration curves of the nomogram at 1-, 3-, and 5-year for LUAD patients from TCGA and GSE41271. Gray line indicates the ideal curve. The green, blue and red lines indicate bias-corrected curve at 1-, 3-, and 5-year. Dots are quartiles of our data set. (E, F) Kaplan-Meier curves of LUAD patients from TCGA and GSE41271 stratified by TNM stage and riskscore. (G, H) The ROC curves of TCGA and GSE41271 illustrating the AUC values of nomogram, CAFRS and TNM stage at 5-year.