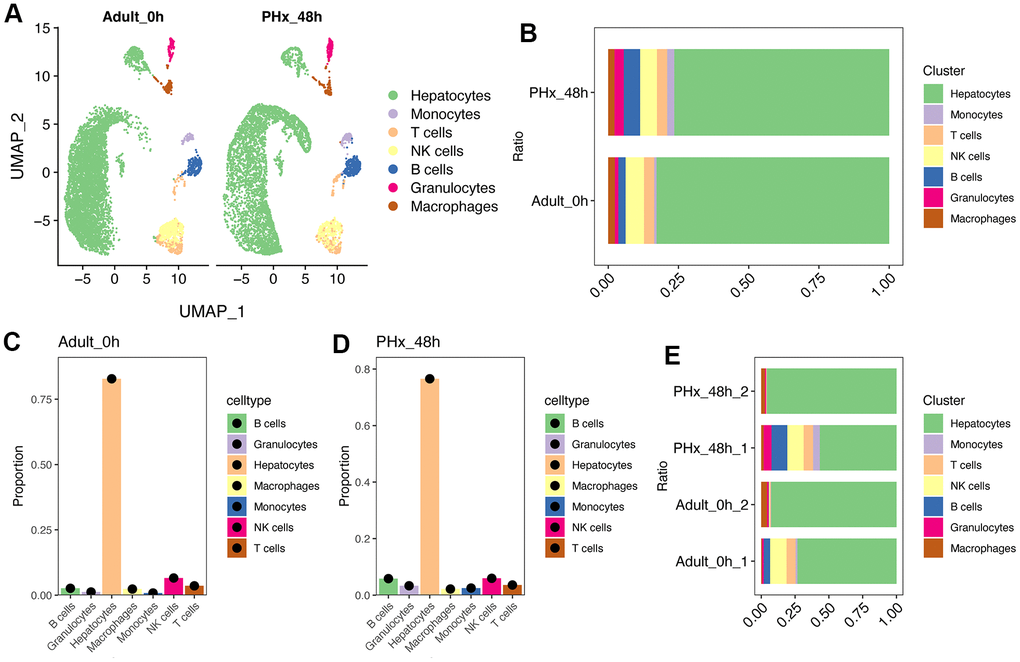
Figure 1.Single cell analysis of cell proportion changes of liver regeneration after PHx. (A) UMAP plot shows the distribution of different cell types of PHx livers. (B) Cell proportion of seven cell types in PHx livers. (C) Bar plot indicates the cell proportion of all seven cell types in liver at 0h after PHx. (D) Bar plot indicates the cell proportion of all seven cell types in liver at 48h after PHx. (E) Cell proportion of seven cell types in PHx livers. The cell proportion in four samples of liver was showed.