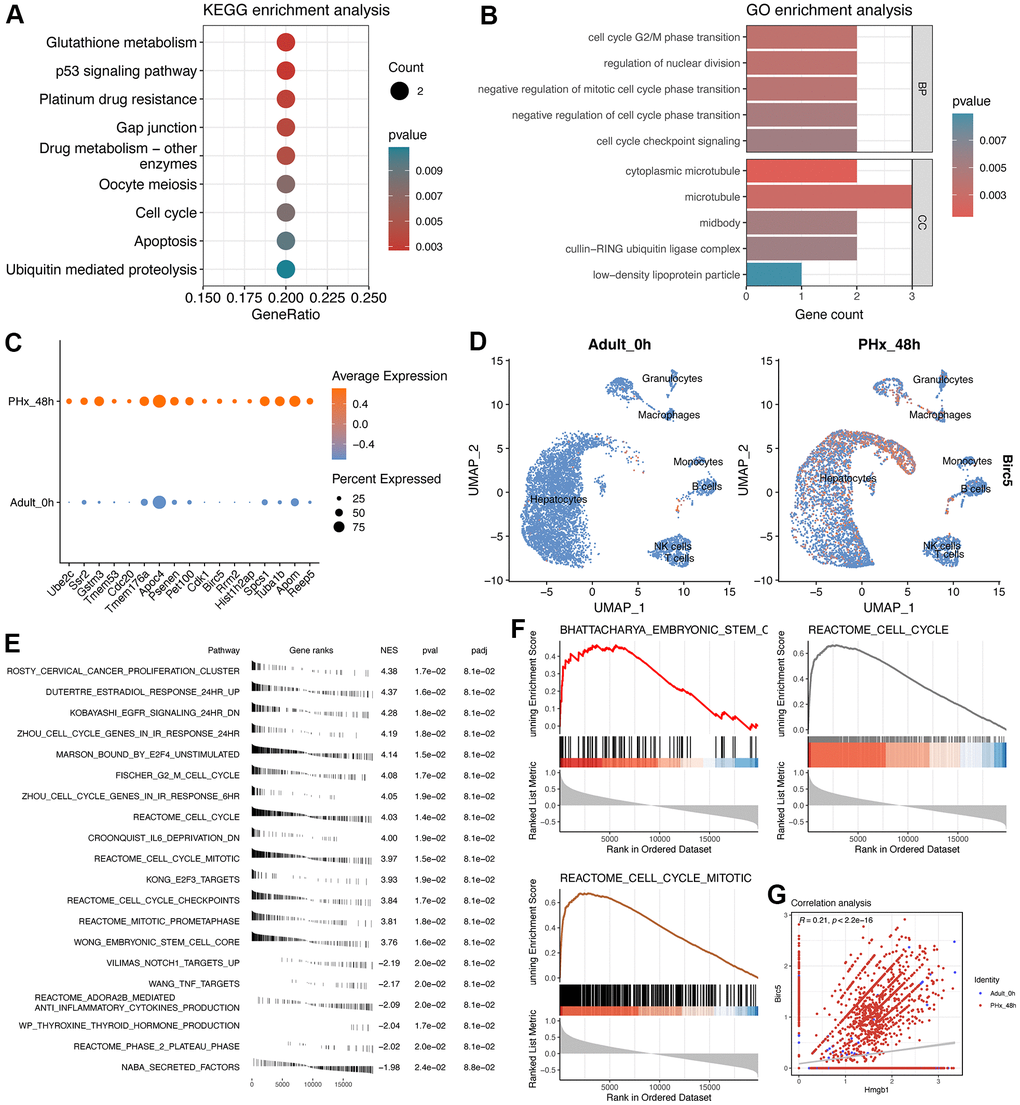
Figure 7.Enrichment analyses of 17-signature-related genes and GSEA analysis of Birc5. (A) KEGG enrichment analysis of 17 regeneration-signature-related genes. Only significant terms were showed and the red color represents lower P value. (B) GO enrichment analysis of 17 regeneration-signature-related genes, showing in bar plot. BP indicates biological process while CC indicates cellular component. (C) Average expression of the 17 genes between PHx 0h and PHx 48 groups, which was displayed using dot plot. (D) Distribution of Birc5 expression in all cell types between PHx 0h and PHx 48 groups. (E) fGSEA analysis of Birc5 and only top significant terms were listed. (F) GSEA analysis of Birc5 gene. The method for ranking detected genes was according to the correlation coefficients with Birc5 gene, which could make us to be capable of enriching Birc5-related terms. (G) correlation analysis between birc5 and Hmgb1.