Submit an Article
Navigate
Home
Editorial Board
Editorial Policies
Current Volume
Archive
Scientific Integrity
Publication Ethics Statements
Interviews with Outstanding Authors
Newsroom
Sponsored Conferences
Podcast
Contact
Special Collections
Submit an Article
Online ISSN: 1945-4589
Research Paper
|
Volume 15, Issue 11
|
pp. 5032–5051
CLDN5 identified as a biomarker for metastasis and immune infiltration in gastric cancer via pan-cancer analysis
Back to article
Figure 9
(9 of 10)
−
100%
+
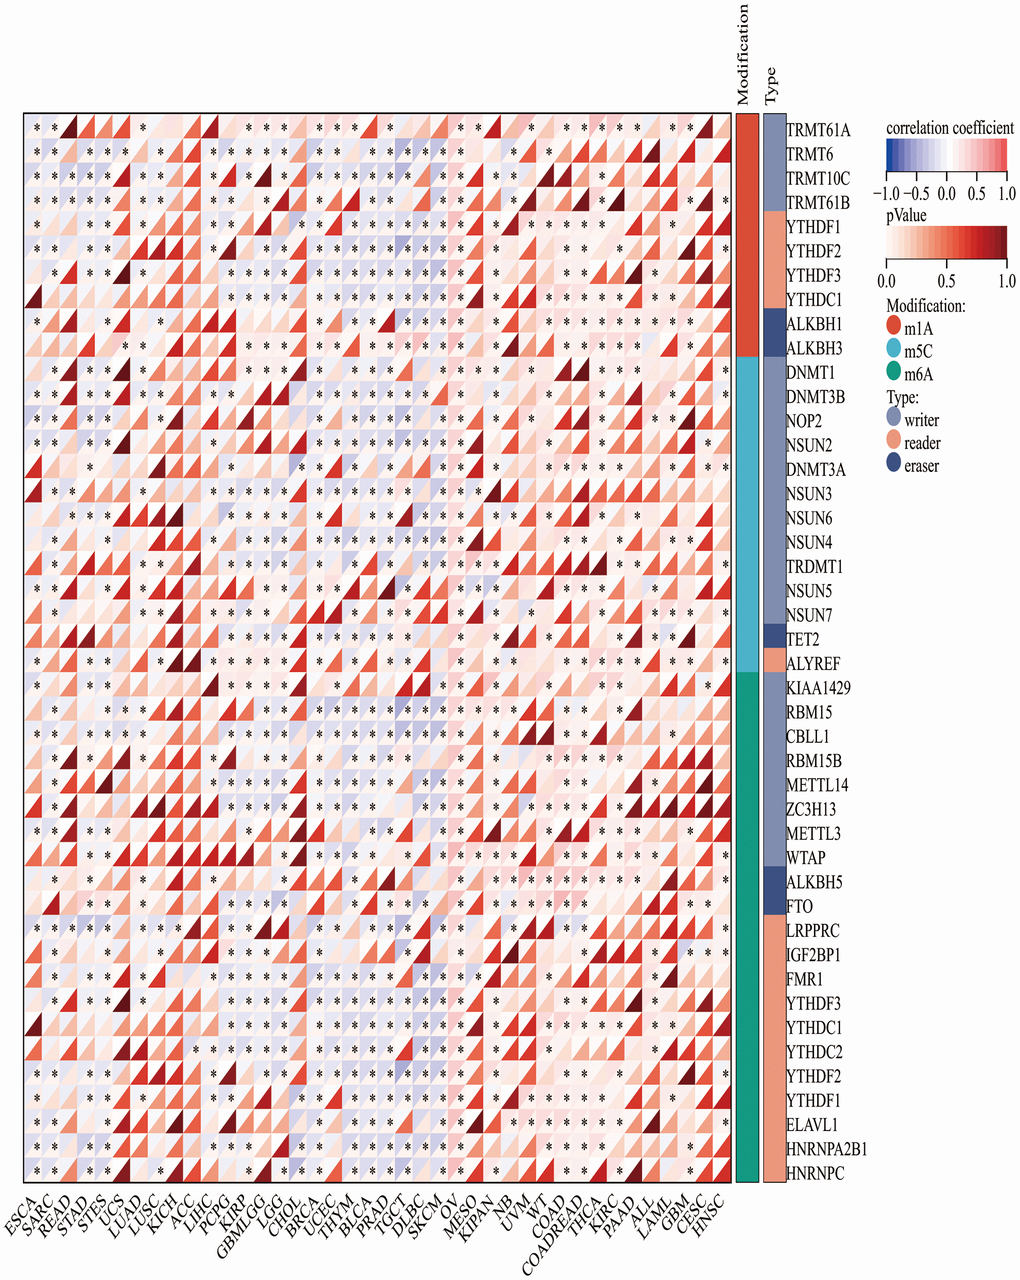
Figure 9.
The association heatmaps between CLDN5 expression and DNA methylesterase genes expression in 33 tumors *P < 0.05, **P < 0.01, ***P < 0.001.