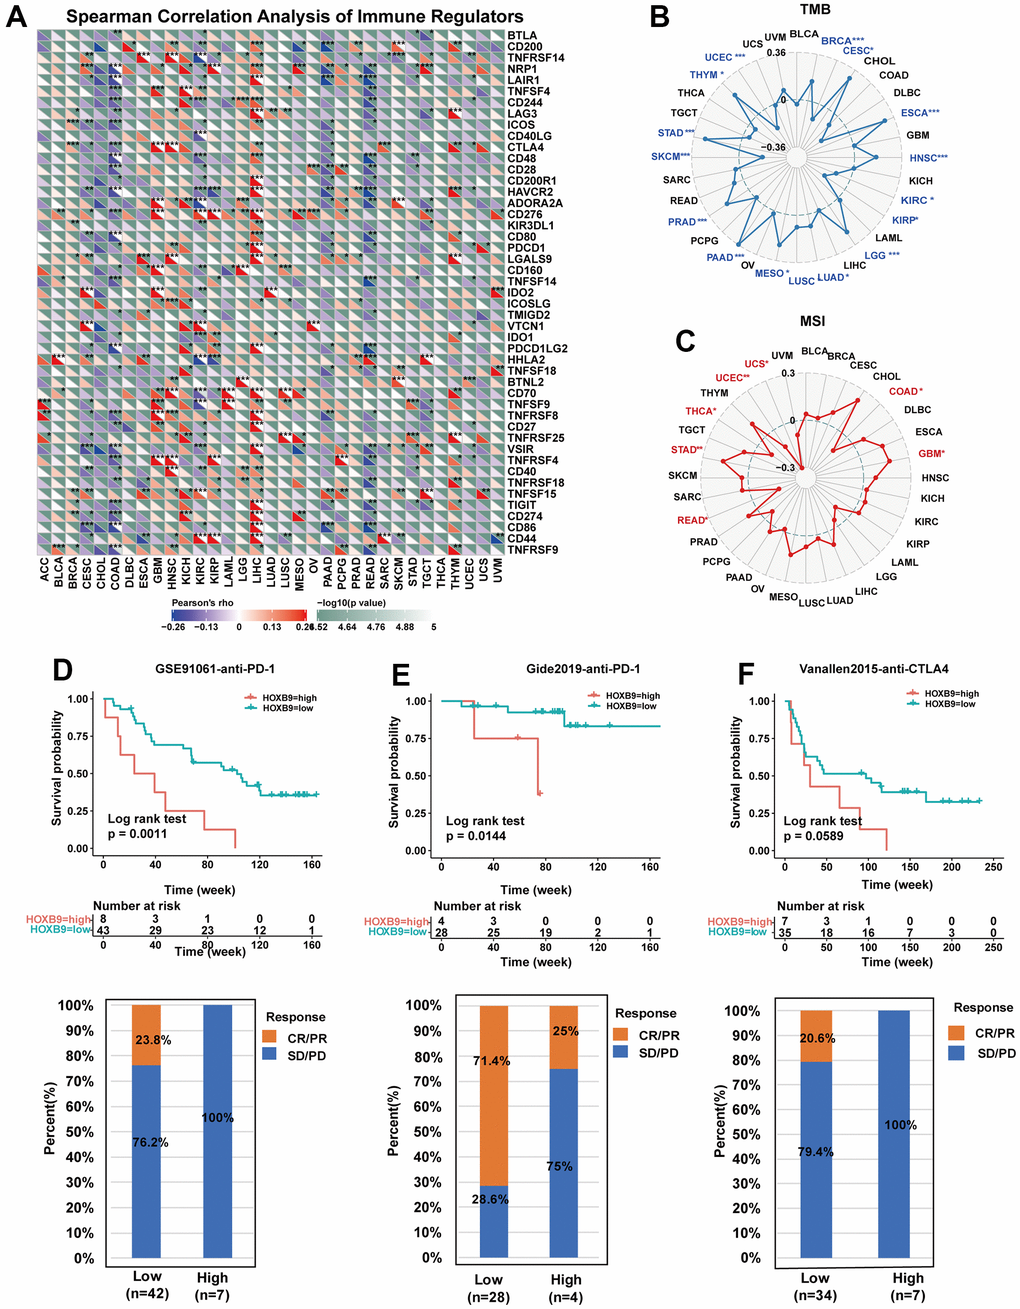
Figure 8.Correlation between HOXB9 and immune regulators, TMB, and MSI. (A) The Spearman correlation heatmap depicts the correlations between the HOXB9 expressions and the different types of immune regulators in pan-cancer. A positive correlation is represented by red, while a negative correlation is represented by blue. (B) Radar map of the correlation between HOXB9 expression and the TMB in pan-cancer. (C) Radar map of the correlation between HOXB9 expression and MSI in pan-cancer. (D) Kaplan-Meier curves for low- and high-HOXB9 patient groups in GSE91061 (anti-PD-1 therapy), and the fraction of melanoma patients responding to anti-PD-1 therapy in low- and high-HOXB9 subgroups of GSE91061. (E) Kaplan-Meier curves for low- and high-HOXB9 patient groups in the Gide2019 cohort (anti-PD-1 and anti-CTLA4 therapy), and the fraction of melanoma tumors patients with response to a combination of anti-PD-1 and anti-CTLA4 therapy in low- and high-HOXB9 subgroups of Gide2019 cohort. (F) Kaplan-Meier curves for low- and high-HOXB9 expression groups from the Vanallen2015 cohort receiving anti-CTLA4 immunotherapy, and proportion of patients with therapeutic response to anti-CTLA4 blockade immunotherapy in low- and high-HOXB9 expression Vanallen2015 cohorts. *P < 0.05, **P < 0.01, ***P < 0.001.