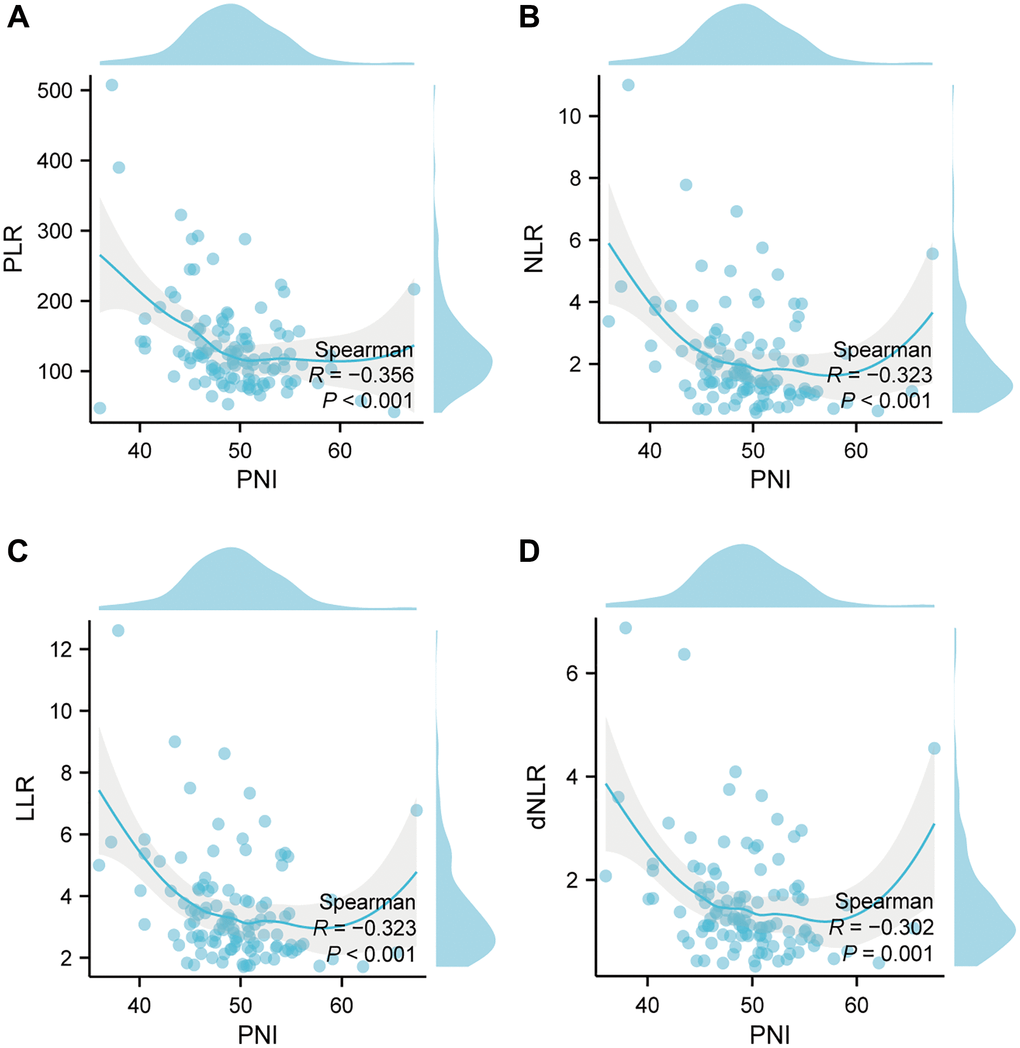
Figure 3.Correlation between nutritional index and inflammatory index in the whole study population. (A) The correlation between PNI and PLR; (B) The correlation between PNI and NLR; (C) The correlation between PNI and LLR; (D) The correlation between PNI and dNLR. Abbreviations: PNI: prognostic-nutrition index; PLR: platelet-lymphocyte ratio; NLR: neutrophil-lymphocyte ratio; LLR: leukocyte-lymphocyte ratio; dNLR: derived neutrophil-lymphocyte ratio; R: correlation.