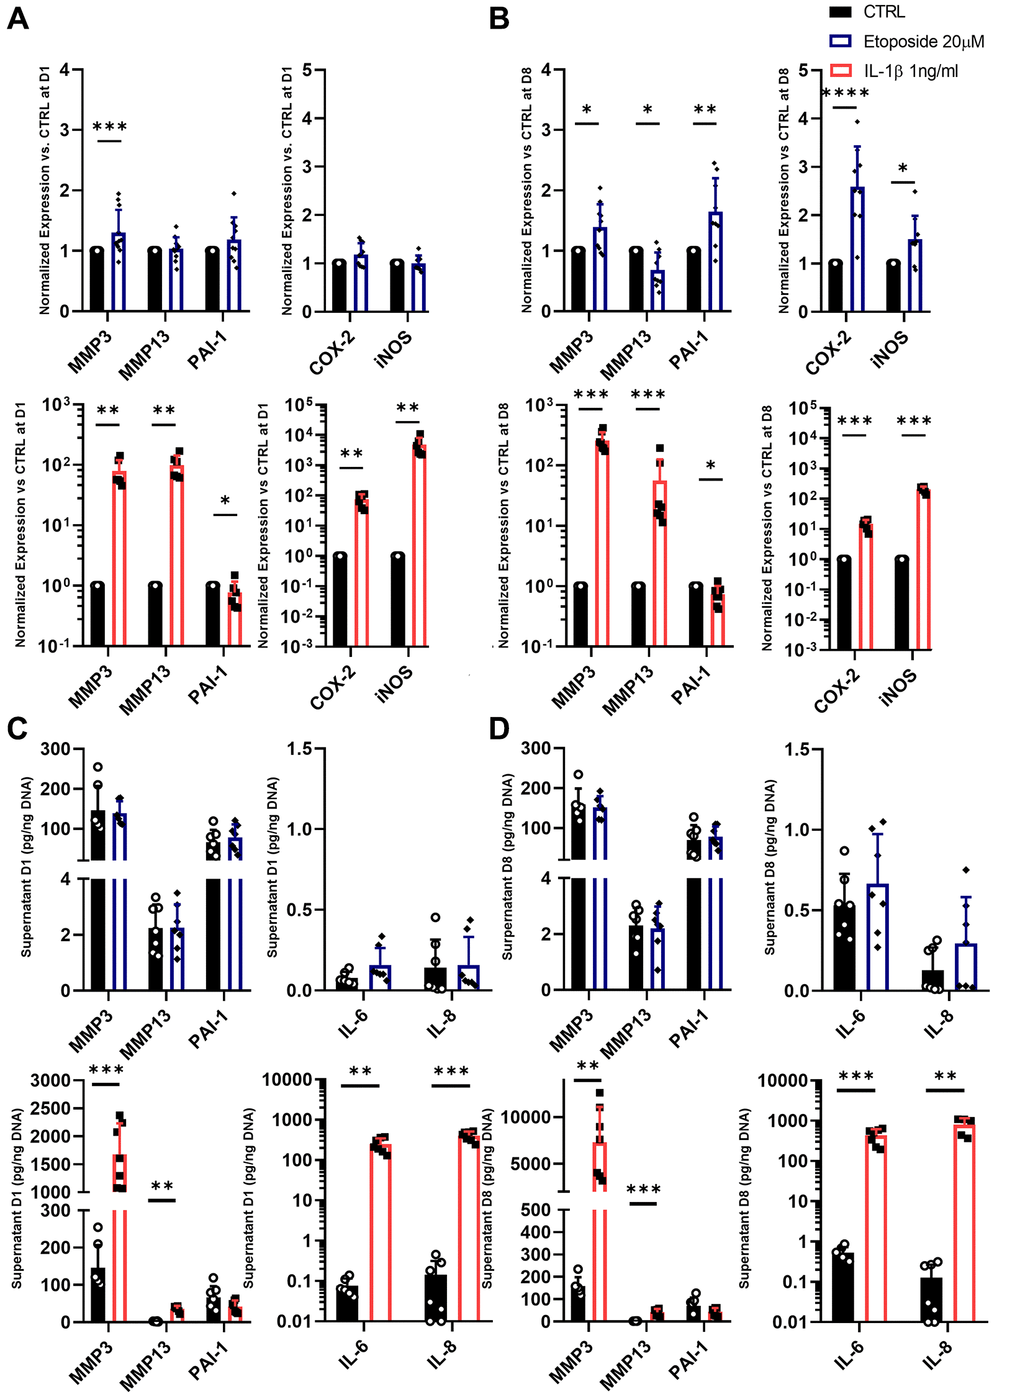
Figure 5.SASP markers in Etoposide and IL-1β treated HACs. (A–D) HACs were treated with Etoposide (blue) at 20 μM for 24 h or IL-1β (red) at 1 ng/mL for the length of the experiment. The expressions of SASP markers were evaluated by RT-qPCR at day 1 (A) and day 8 (B), and SASP components were quantified by Luminex assay in the culture medium at day 1 (C) and 8 (D). Data are shown as mean ± SD, (n ≥ 3). P-values were calculated by Mann-Whitney test, *p ≤ 0.05; **p < 0.01; ***p < 0.001; ****p < 0.0001.