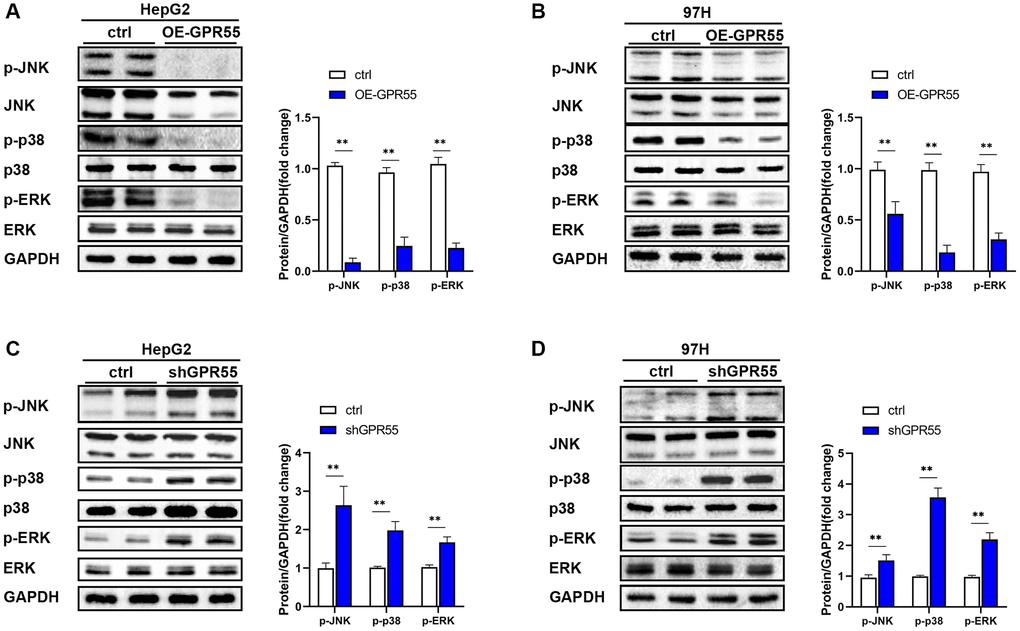
Figure 10.(A) The expression of MAPK pathway related proteins in GPR55 overexpression group and control group were detected by western-blotting in HepG2 cells, respectively. (B) The expression of MAPK pathway related proteins in GPR55 overexpression group and control group were detected by western-blotting in 97H cells, respectively. (C) The expression of MAPK pathway related proteins in GPR55 low expression group and control group were detected by western-blotting in HepG2 cells, respectively. (D) The expression of MAPK pathway related proteins in GPR55 low expression group and control group were detected by western-blotting in 97H cells, respectively. N = 3, ***P < 0.01, t-test.