Submit an Article
Navigate
Home
Editorial Board
Editorial Policies
Current Volume
Archive
Scientific Integrity
Publication Ethics Statements
Interviews with Outstanding Authors
Newsroom
Sponsored Conferences
Podcast
Contact
Special Collections
Submit an Article
Online ISSN: 1945-4589
Research Paper
|
Volume 15, Issue 17
|
pp. 8930–8947
A comprehensive survival and prognosis analysis of GPR55 expression in hepatocellular carcinoma
Back to article
Figure 2
(2 of 10)
−
100%
+
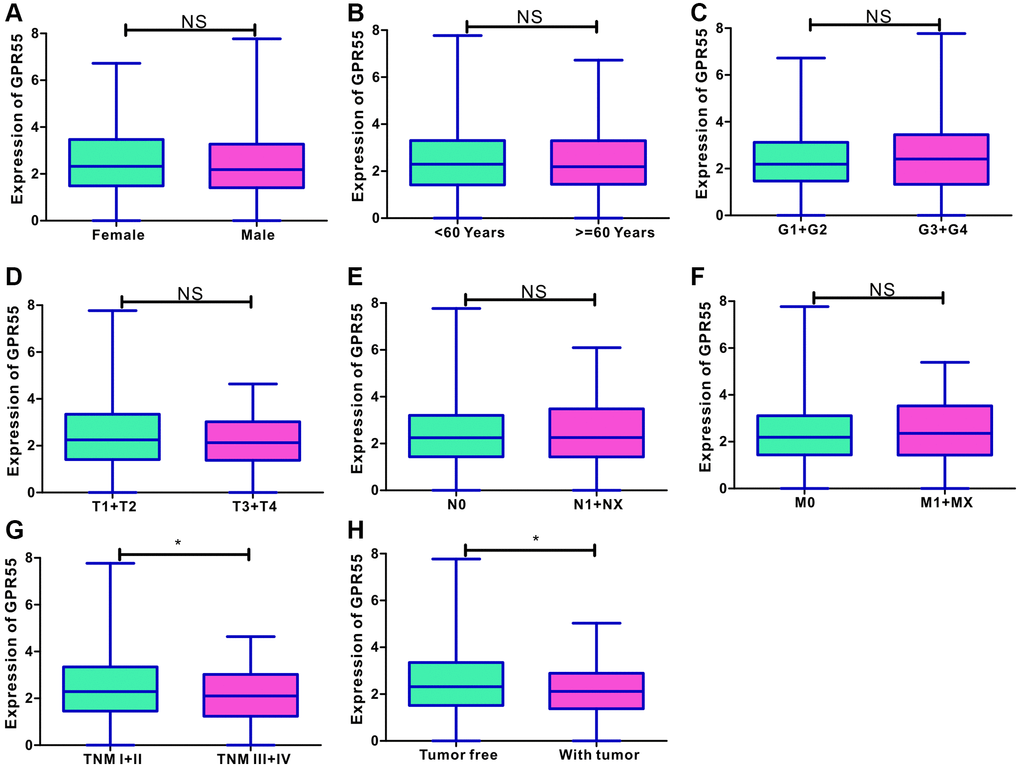
Figure 2.
(
A
–
F
) Correlation analysis of GPR55 with age, sex, histological grade, TNM stage and tumor status. (
G
,
H
) The dot plots of GPR55 expression in HCC individuals with TNM I/II stage, and in tumor free individuals. (
*
P
< 0.05).