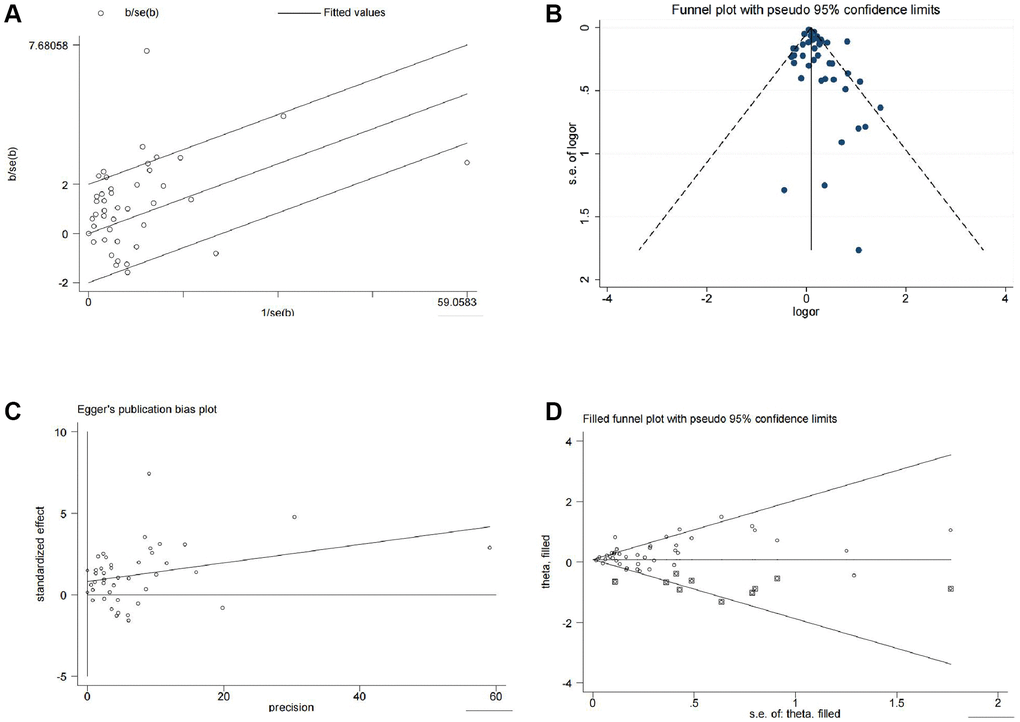
Figure 3.Heterogeneity, publication bias, and sensitivity analysis of the 13 studies. (A) Galbraith plot for heterogeneity analysis. (B) Funnel plot for visual inspection of publication bias. (C) Egger’s funnel plot for quantitative evaluation of publication bias. (D) Funnel plot for sensitivity analysis using the trim and fill method.