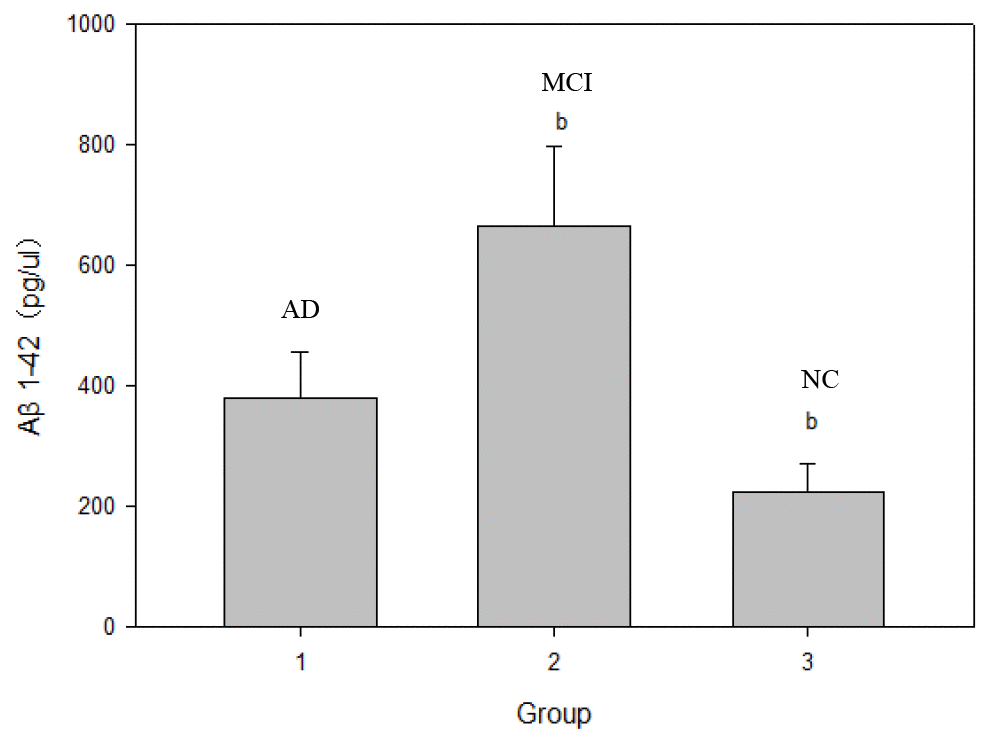
Figure 2.Comparison of serum Aβ1-42 protein levels in NC, MCI and AD groups. Note: b represents **P; **P represents the comparison between MCI and NC groups.
Figure 2 — Serum sirtuin1: a potential blood biomarker for early diagnosis of Alzheimer’s disease | Aging