Submit an Article
Navigate
Home
Editorial Board
Editorial Policies
Current Volume
Archive
Scientific Integrity
Publication Ethics Statements
Interviews with Outstanding Authors
Newsroom
Sponsored Conferences
Podcast
Contact
Special Collections
Submit an Article
Online ISSN: 1945-4589
Research Perspective
|
Volume 15, Issue 17
|
pp. 8537–8551
A Poisson distribution-based general model of cancer rates and a cancer risk-dependent theory of aging
Back to article
Figure 2
(2 of 6)
−
100%
+
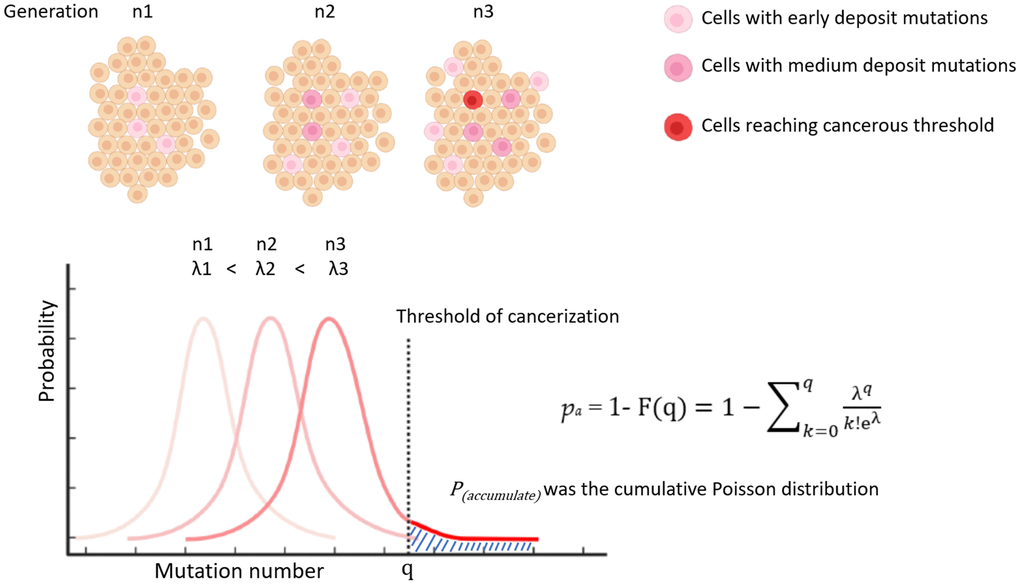
Figure 2.
Illustration of modelling P
(accumulate)
by cumulative poisson distribution.