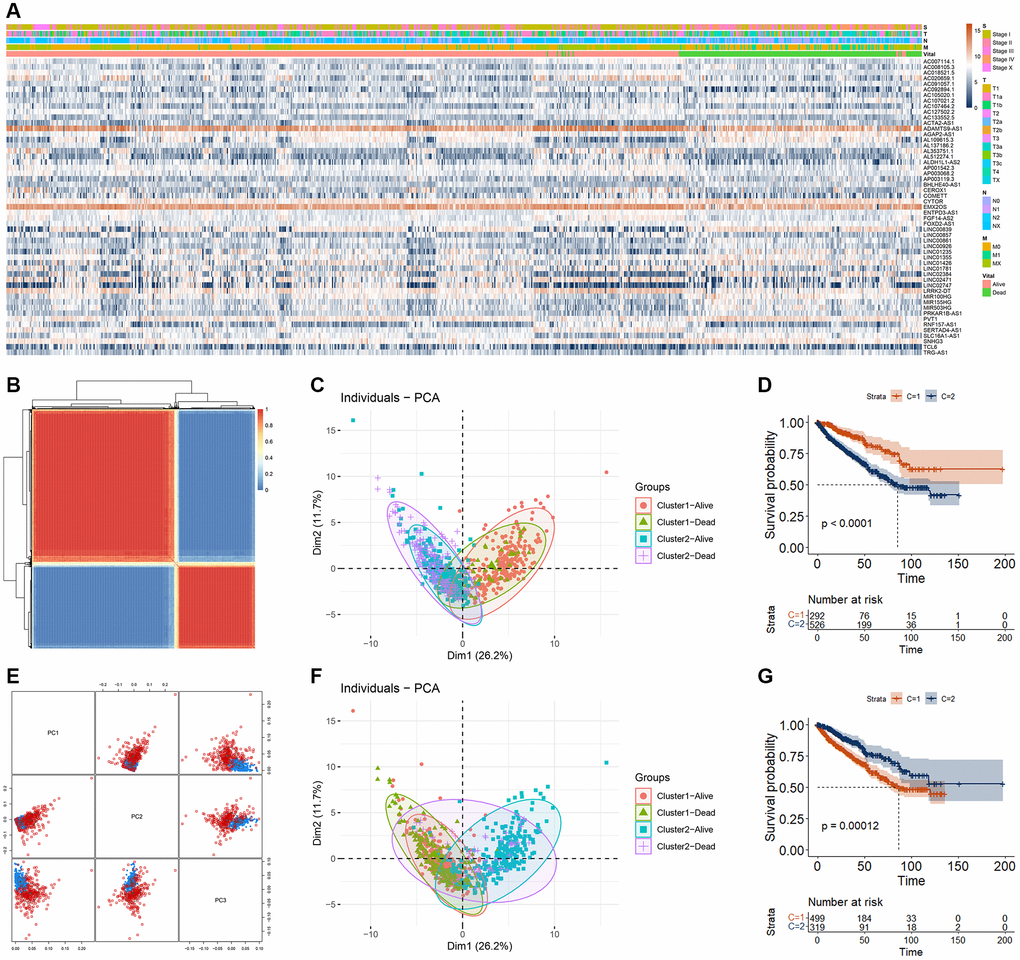
Figure 2.RCC cluster analysis based on DECRLs. (A) Heatmap of 53 DECRLs. (B) Cluster of RCC patients based on consensus analysis. (C) The distribution of RCC patients in different cluster (base on consensus analysis) and different survival status. (D) K-M curve of RCC patients with different cluster (base on consensus analysis). (E) Cluster of RCC patients based on MClust analysis. (F) The distribution of RCC patients in different cluster (base on MClust analysis) and different survival status. (G) K-M curve of RCC patients with different cluster (base on MClust analysis).