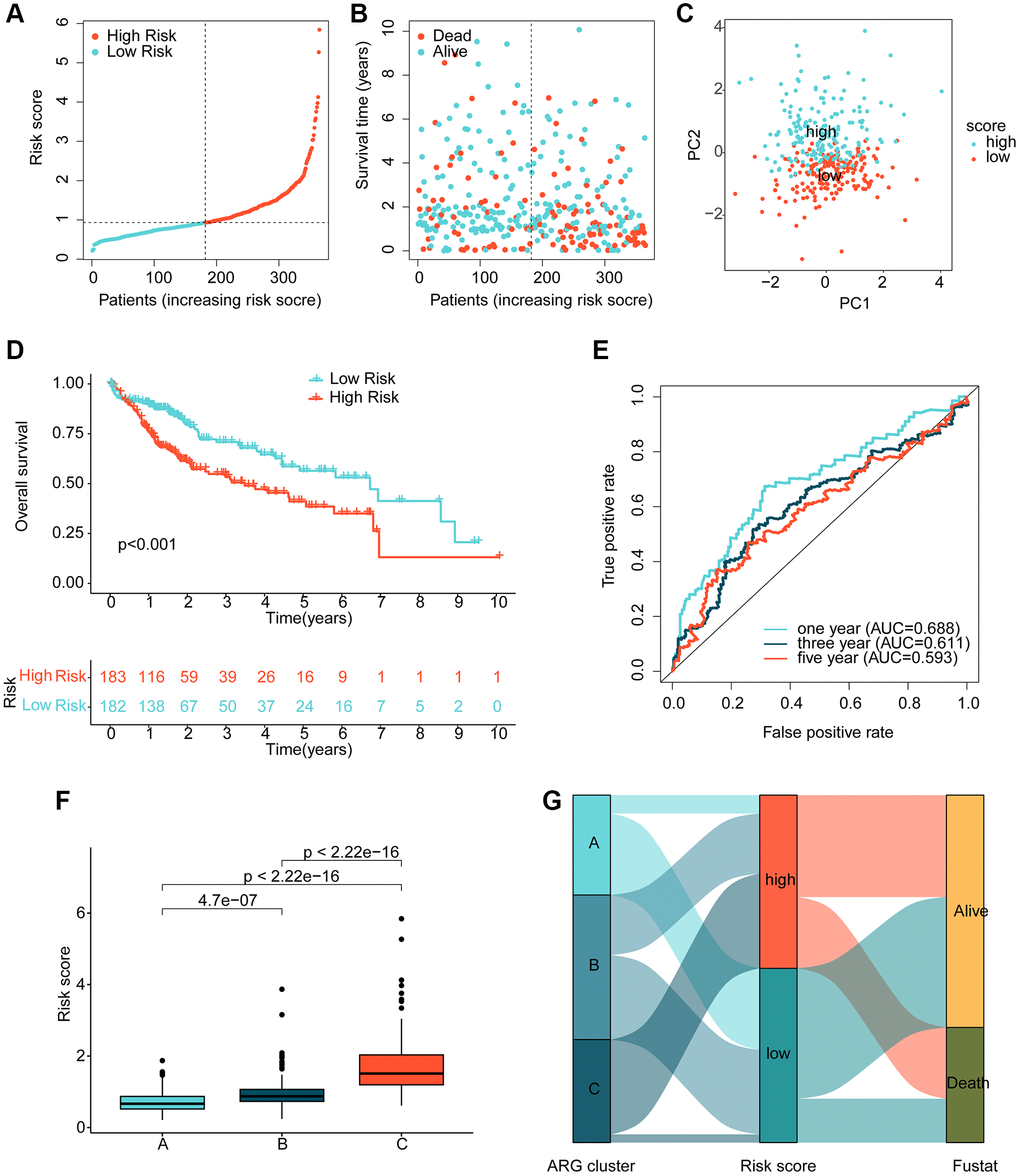
Figure 4.Risk model development based on prognostic ARGs. (A, B) Subgroup analysis of HCC risk based on prognostic ARGs. (C) Unsupervised PCA analysis. (D) Clinical survival outcome assessment of HCC risk subgroups. (E) Time-dependent ROC curve analysis. (F) Risk score distribution of HCC molecular subtypes. (G) Association analysis of HCC molecular subtypes, risk subgroups and clinical survival outcomes.