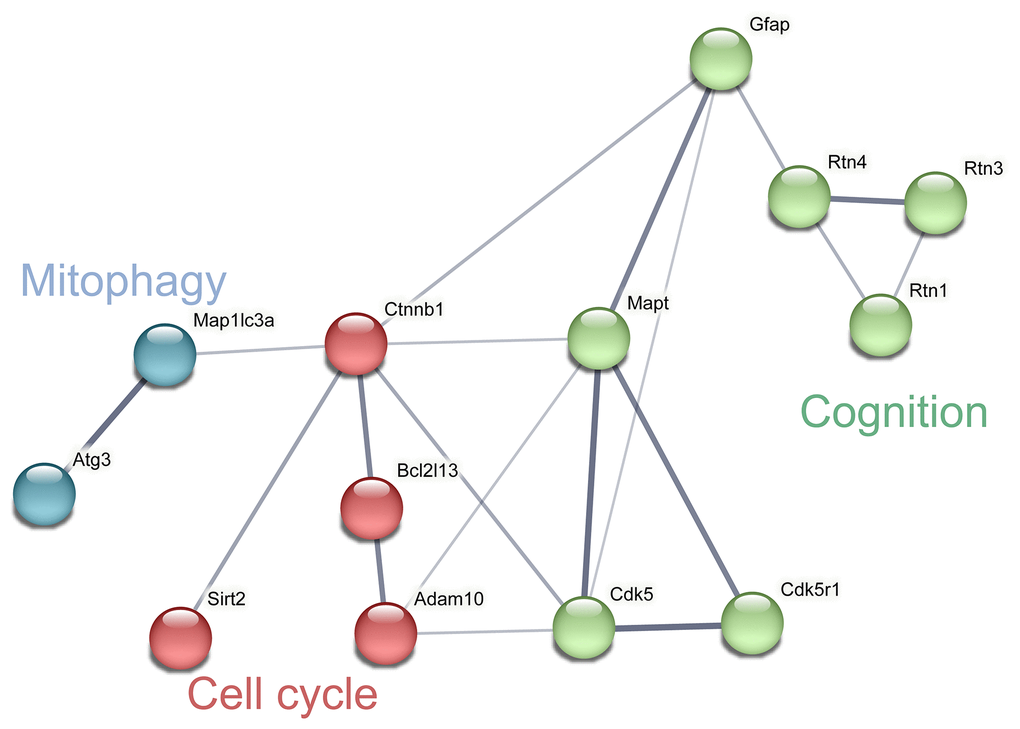
Figure 3.Network analysis and visualization of related proteins including cycle, mitophagy and cognition. The thickness of the line indicates the confidence of interaction. Different marker colors indicate varied clusters of protein function (Blue represents mitophagy, red represents cell cycle and green represents cognition).