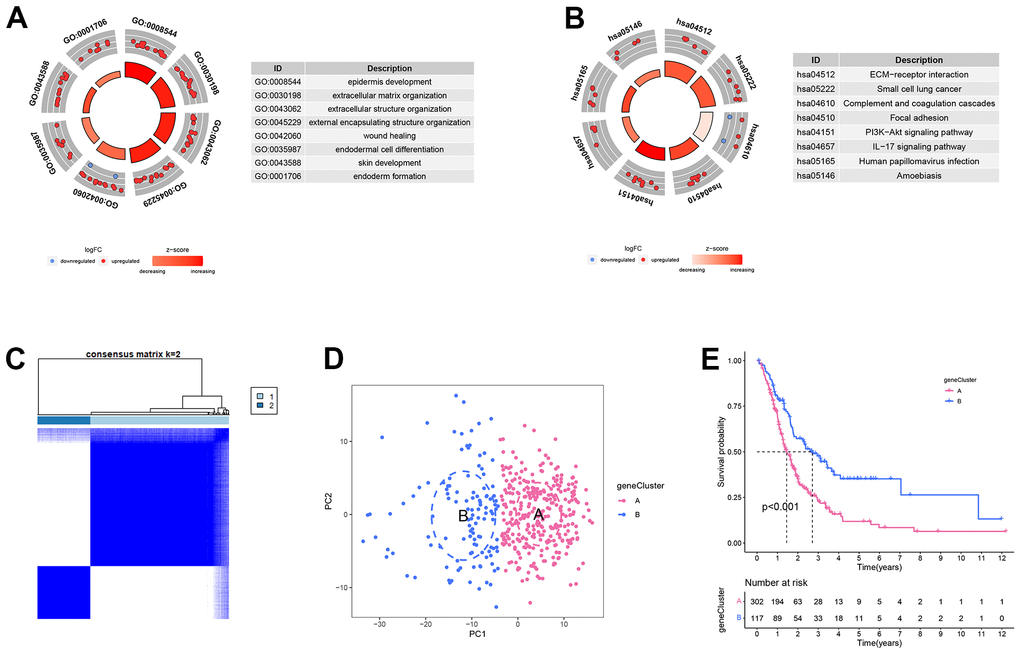
Figure 4.Differentially expressed analysis in the different endoplasmic reticulum stress-related subtypes. (A) GO enrichment analysis. (B) KEGG enrichment analysis. (C) Heatmap of consensus matrix when k = 2. (D) The principal component analysis could remarkably distinguish geneCluster A and B. (E) The survival curve of geneCluster A and B.