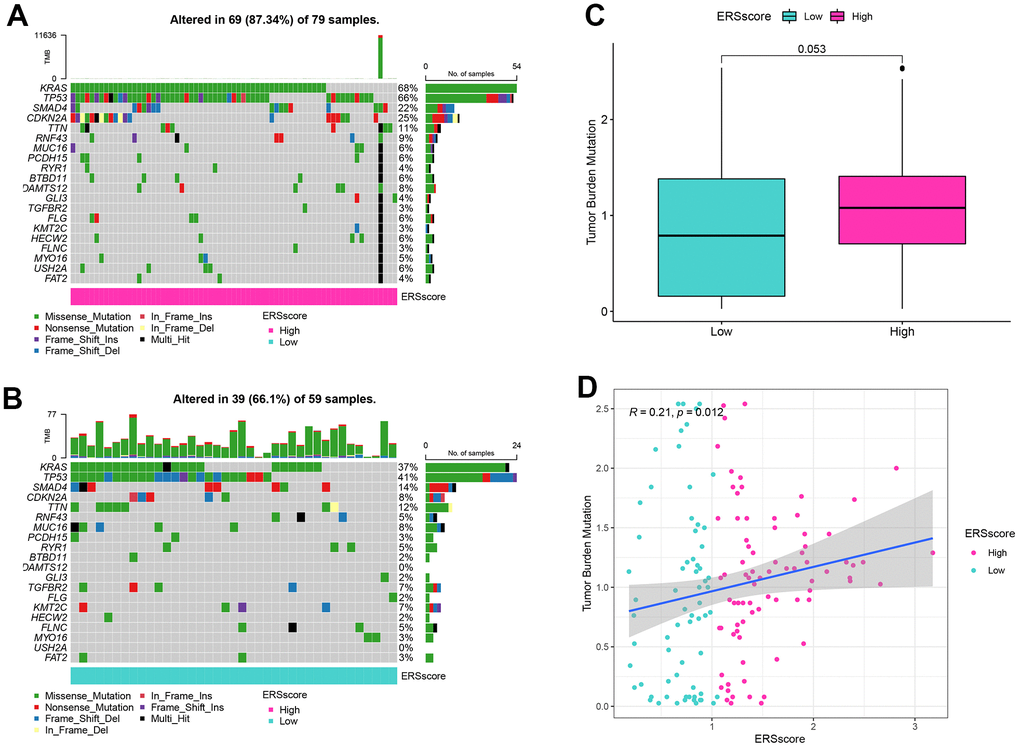
Figure 7.Mutation analysis. (A) Waterfall map of mutation landscape within the high ERS score group. (B) Waterfall map of mutation landscape within the low ERS score group. (C) The tumour mutation burden (TMB) between the different ERS score groups. (D) Correlation of TMB and ERS score.