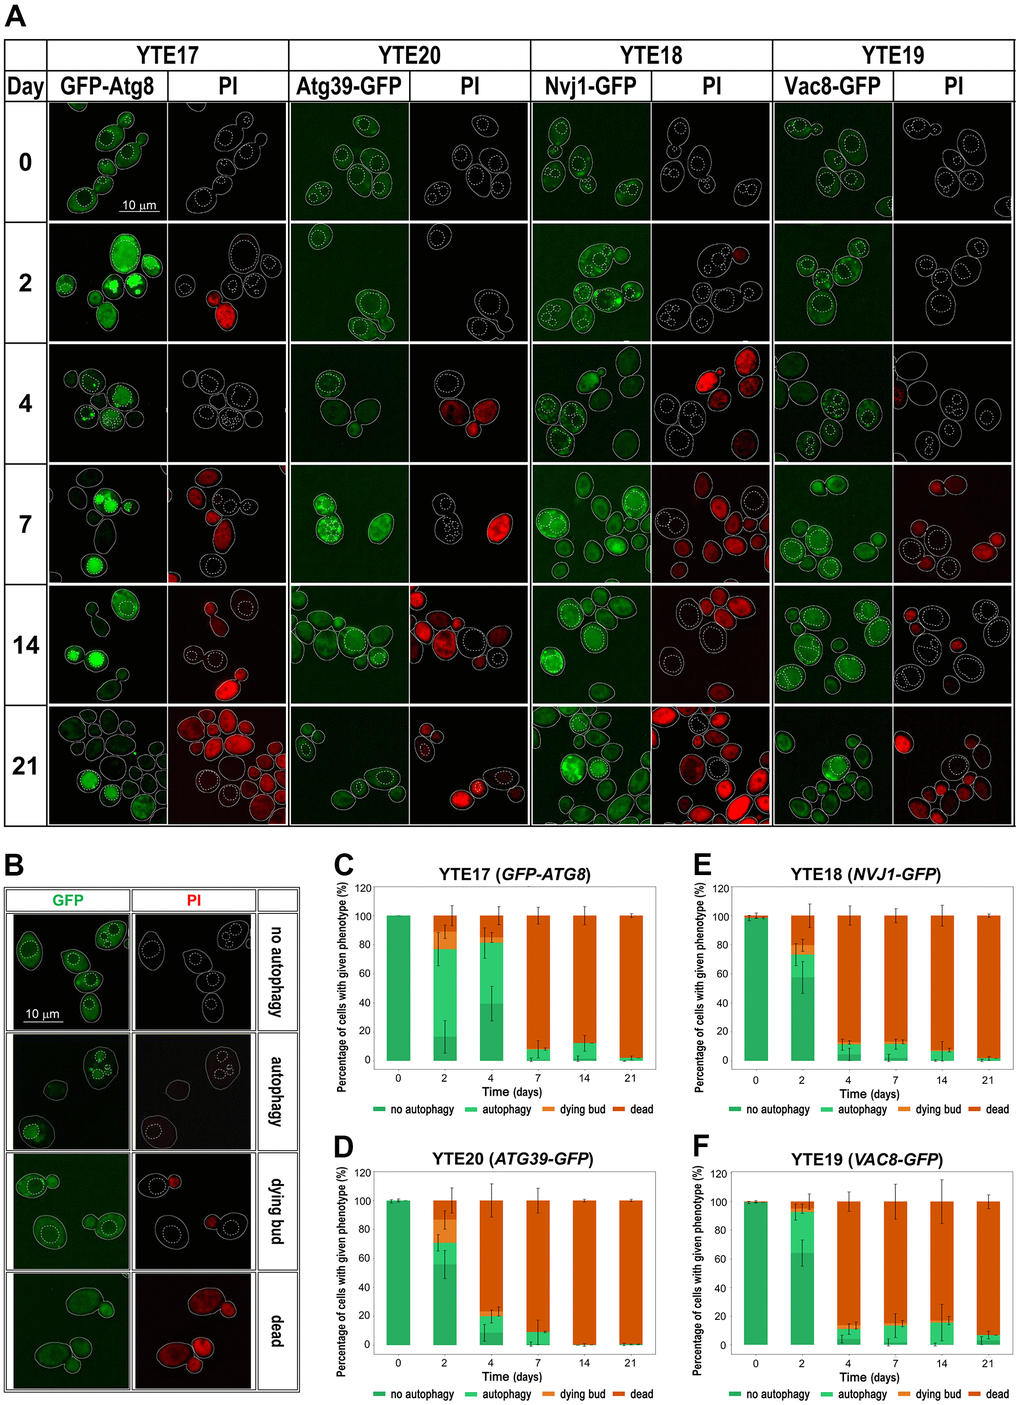
Figure 5.Changes in the autophagy markers’ localization during chronological aging. (A) Microscopic analysis of strains carrying fluorescently tagged autophagy markers: YTE17 (GFP-ATG8), YTE20 (ATG39-GFP), YTE18 (NVJ1-GFP), and YTE19 (VAC8-GFP) in a given day of CLS experiment. Examples shown in (A) are focused on cells that were still viable at the analyzed time point. The microscopic images were collected and processed under the same conditions, so the differences in signal intensity are veritable. Cell borders are marked with solid lines, and vacuole outlines, determined based on CMAC staining, are marked with a dashed line. (B) Categories of counted phenotypes - examples. (C–F) The microscopic results quantification is shown as a percentage of cells presenting a given phenotype in the population from a specific time point. Three biological repetitions were performed; in each, at least 300 cells were analyzed for every time point. Graphs show the mean of all biological repetitions; whiskers represent standard deviations. Results obtained for YTE17 (GFP-ATG8) (C), YTE20 (ATG39-GFP) (D), YTE18 (NVJ1-GFP) (E), and YTE19 (VAC8-GFP) (F) are shown.