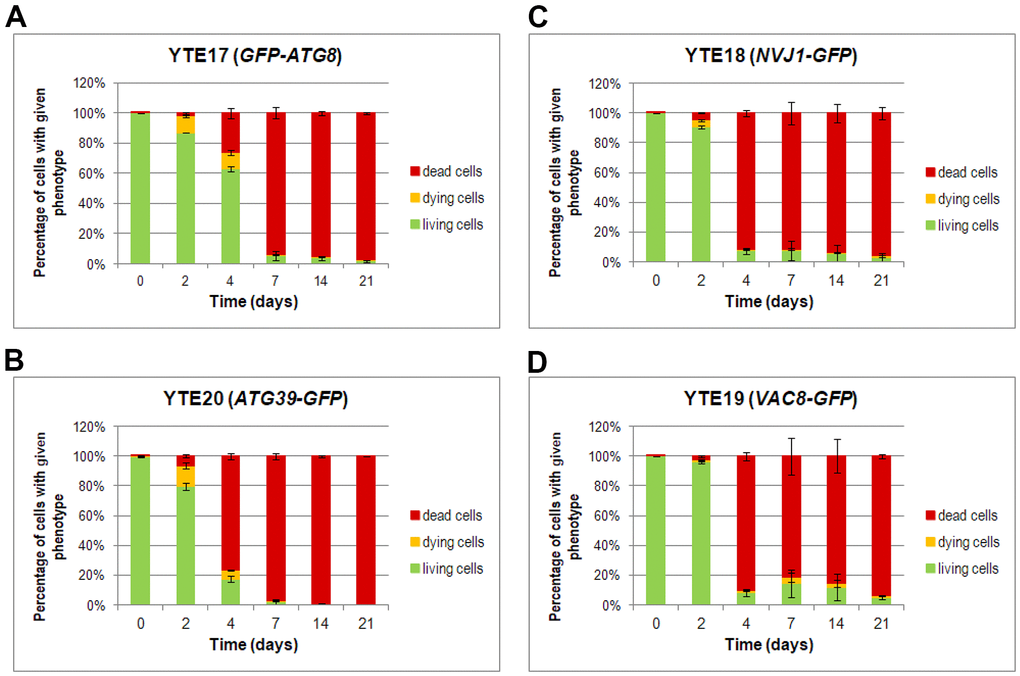
Figure 6.Changes in the cell viability during CLS, measured by flow cytometry. Cells of YTE17 (GFP-ATG8), YTE20 (ATG39-GFP), YTE18 (NVJ1-GFP), and YTE19 (VAC8-GFP) strains were stained with PI, and fluorescence signals were analyzed in two channels: FL1-H (for GFP) and FL2-H (for PI-stained cells) by flow cytometry in each day of the CLS experiment. According to the presented fluorescence signal, cells in the population were divided into three subpopulations: living, dying, and dead. See Supplementary Material Figures for gating conditions and histograms for each channel for strains and time points. (A–D) The flow cytometry results quantification was shown as a percentage of cells presenting a given phenotype in the population at a specific time point. Three biological repetitions were performed; and 10,000 events were analyzed for every strain and time point. Graphs show the mean of all biological repetitions; whiskers represent standard deviations. Results obtained for YTE17 (GFP-ATG8) (A), YTE20 (ATG39-GFP) (B), YTE18 (NVJ1-GFP) (C), and YTE19 (VAC8-GFP) (D) are shown.