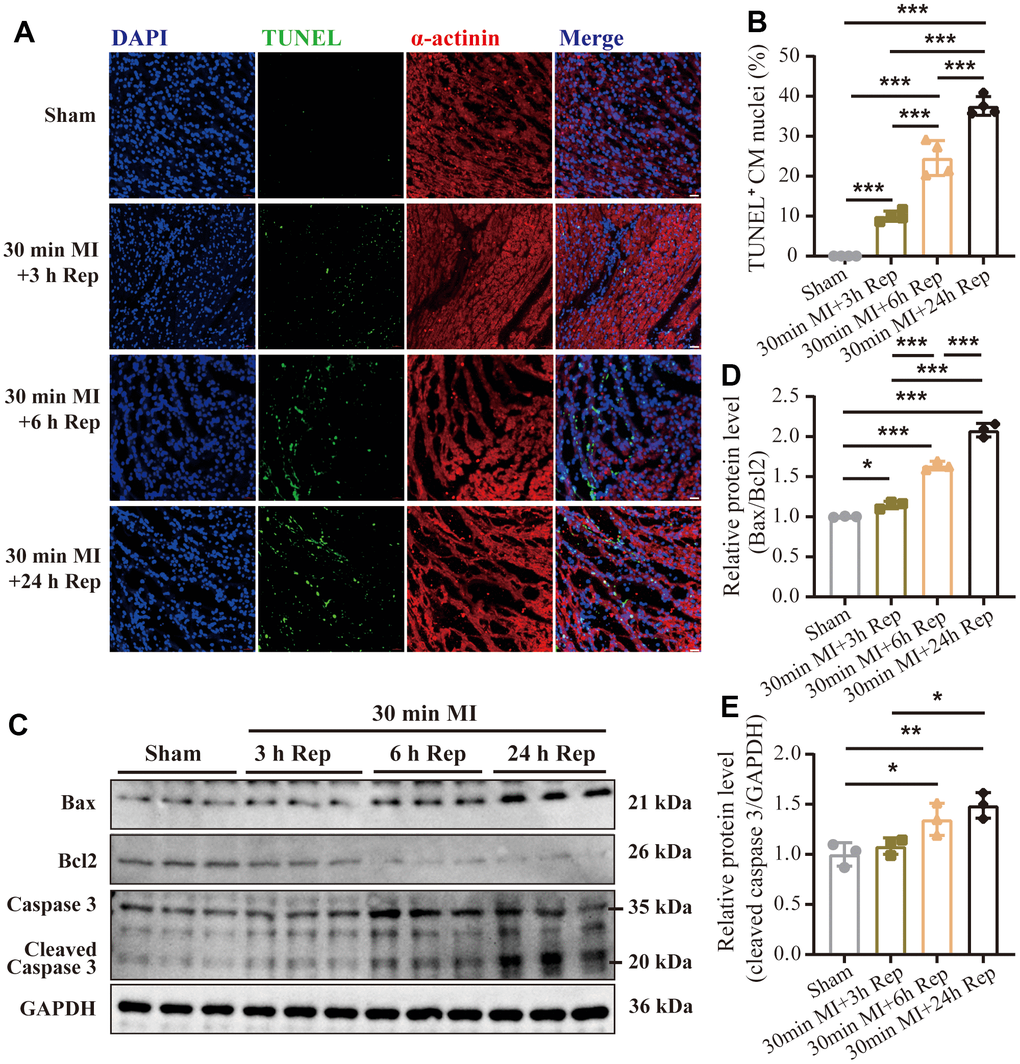
Figure 2.Progression of apoptotic cell after ischemia and reperfusion. (A) Representative images of immunofluorescence staining and (B) quantification of the TUNEL positive cardiomyocytes in mouse hearts treated as indicated (n = 4 : 4 : 4 : 4) Scale bar: 100 μm. (C) Representative western blot and (D, E) statistical data of myocardium apoptosis by detection of Bax, Bcl2, and Cleaved-Caspase 3 expression levels in mouse hearts treated as indicated (n = 3 : 3 : 3 : 3). MI=Myocardial infarction, Rep=reperfusion. Data are shown as mean ± SD. One-way ANOVA followed by Tukey post hoc test was used for statistical comparisons between multiple groups. *P < 0.05; **P < 0.01; ***P < 0.001.