Submit an Article
Navigate
Home
Editorial Board
Editorial Policies
Current Volume
Archive
Scientific Integrity
Publication Ethics Statements
Interviews with Outstanding Authors
Newsroom
Sponsored Conferences
Podcast
Contact
Special Collections
Submit an Article
Online ISSN: 1945-4589
Research Paper
|
Volume 15, Issue 20
|
pp. 11389–11411
Development of an immunogenic cell death prognostic signature for predicting clinical outcome and immune infiltration characterization in stomach adenocarcinoma
Back to article
Figure 9
(9 of 11)
−
100%
+
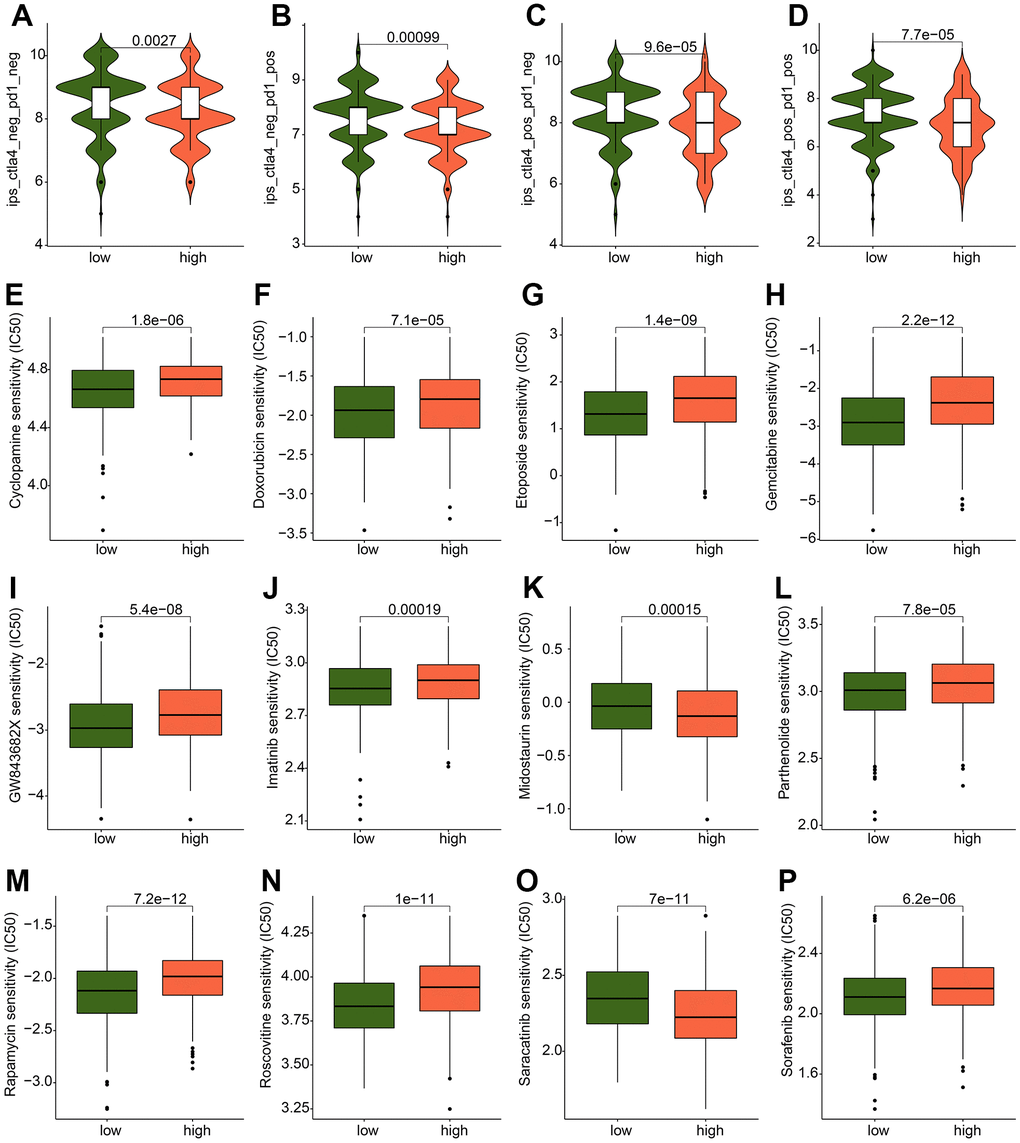
Figure 9.
Drug sensitivity analysis between the ICDRG score subtypes.
(
A
–
D
) IPS evaluation shows the response to PD-1 and CTLA-4 of GC in ICDRG score subtypes. (
E
–
P
) Prediction of chemotherapy drug for GC in ICDRG score subgroups.