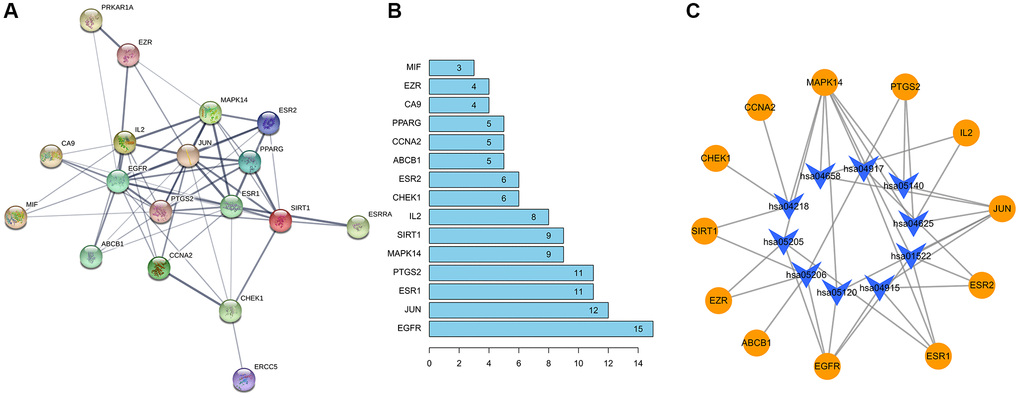
Figure 7.Construction of PPI network diagram (A) The protein interaction diagram. (B) The abscissa represents the number of related pairs of genes in the network diagram. (C) The formononetin-OS target gene network.
Figure 7 — Anti-cancer targets and molecular mechanisms of formononetin in treating osteosarcoma based on network pharmacology | Aging